Monday, July 29, 2013

How is the St Venant Equation Solved for in the Dynamic Wave Solution of SWMM 5?

Subject:   How is the St Venant Equation Solved for in the Dynamic Wave Solution of SWMM 5?

An explanation of the four St. Venant Terms in SWMM 5 and how they change for Gravity Mains and Force Mains. The HGL is the water surface elevation in the upstream and downstream nodes of the link. The HGL for a full link goes from the pipe crown elevation up to the rim elevation of the node + the surcharge depth of the node.  The four terms are:

dq2 = Time Step * Awtd * (Head Downstream – Head Upstream) / Link Length or
dq2 = Time Step * Awtd * (HGL) / Link Length
Qnew = (Qold – dq2 + dq3 + dq4) / ( 1 + dq1)
when the force main is full dq3 and dq4 are zero and
Qnew = (Qold – dq2) / ( 1 + dq1)
The dq4 term in dynamic.c uses the area upstream (a1) and area downstream (a2), the midpoint velocity, the sigma factor (a function of the link Froude number), the link length and the time step or
dq4 = Time Step * Velocity * Velocity * (a2 – a1) / Link Length * Sigma
the dq3 term in dynamic.c uses the current midpoint area (a function of the midpoint depth), the sigma factor and the midpoint velocity
dq3 = 2 * Velocity * ( Amid(current iteration) – Amid (last time step) * Sigma
dq1 = Time Step * RoughFactor / Rwtd^1.333 * |Velocity|
The weighted area (Awtd) is used in the dq2 term of the St. Venant equation:
dq2 = Time Step * Awtd * (Head Downstream – Head Upstream) / Link Length

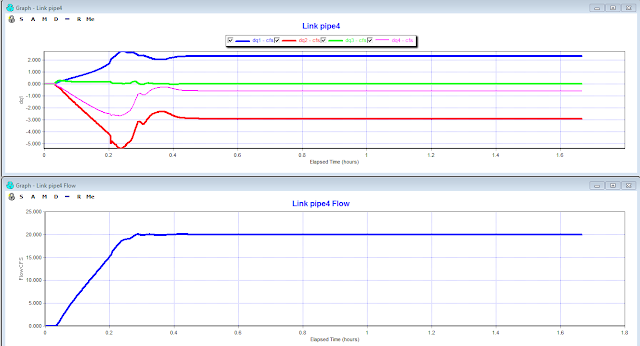
The four terms change at each iteration and time step to determine the new flow (Figure 1) based on the two equations:

Denom = 1 + dq1 + dq5
Q = [Qold – dq2 + dq3 + dq4] / Denom

If you look at a table of the values you will see that the terms add up to zero when the flow is constant and to delta Q or the change in Q when the flow is NOT constant (Figure 2).
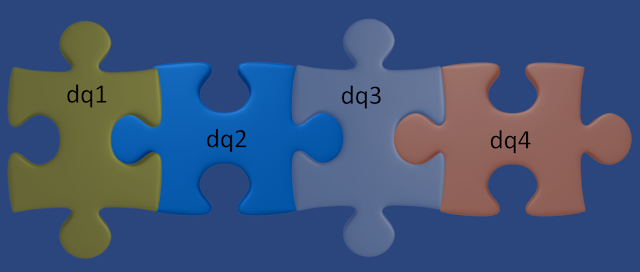


Figure 1.  The four terms define the new flow at each iteration in the dynamic wave solution of SWMM5
  
Figure 2.   The magnitude of the four terms determine the flow at the new iteration and ultimately the new Time Step.  If the flow is constant then the value of the term is constant.

Sunday, July 28, 2013

InfoSWMM and H2oMAP SWMM Map Display of d/D

Note:  You can use the Output Statistics Manager in InfoSWMM and H2OMAP SWMM to compute the peak d/D for ALL of the links in your network. Once you have calculated the peak d/D using the tool you can copy them using the command Ctrl-C and paste them to a new field in the Conduit Information DB Table.  The pasted mean flow from the Conduit Information table then can be mapped using Map Display.

Step 1:  Use Run Manager and Run the Simulation


Step 2:  Use the Output Report Manager and view the Conduit Summary Table


Step 3:  Select the links you want to analyze using the pick tool.


Step 4:  Copy the Peak d/D values using the command Copy after a Right Mouse Click.


Step 5:  Paste the Peak d/D values using the command Paste after a Right Mouse Click in the created DOVERD Field in the Conduit Information DB Table.


Step 6:  Map the Conduit.DOVERD variable from the Conduit Information DB Table.


Step 7:  Now Display the Peak d/D for each link.


Pump / Force Main System in InfoSWMM and SWMM 5 - with Emojis

Subject: 🚀 Pump / Force Main System in InfoSWMM and SWMM 5

Introduction: 💡 The Pump/Force Main system in InfoSWMM and SWMM 5 is a critical component for effective wastewater management. It ensures that wastewater flows smoothly from its source to the desired destination. Let's explore its components and the steps to set it up!

📌 The Basic System:

  • Wet Well with its parameters 🕳️
  • Pump Type 🔄
  • Defined Pump Curve 📈
  • Downstream Pressure Node 📍
  • Downstream Force Main 🛤️
Figure 1:  The Basic System

Step 1: Wet Well Data 📋

  • Input the invert elevation and maximum depth of the Wet Well.
  • Define the shape, considering evaporation or infiltration factors.


Step 2: Define the Pump Type 🔄

  • The pump's operation is guided by its Pump Curve and the set On and Off elevations.
  • The four primary pump types include:
    • Volume - Flow 🌊
    • Depth – Flow 📏
    • Head – Flow 📌
    • Depth - Flow 📊

Step 3: Define the Pump Curve 📈

  • Under the Operation Tab, outline the desired pump curve to ensure efficient pump functioning.


Step 3:  Define the Pump Curve in the Operation Tab 


Step 4: Set a Surcharge or Pressure Depth 🌡️
  • By setting a positive Surcharge Depth at the Downstream node, you ensure that during the simulation, the node remains pressurized, driving the flow through the Force Main.
  • This plot offers a visual representation of the hydraulic gradient line (HGL) for the Force Main System, showcasing the pressure changes within the system.

  • Define the downstream conduits emerging from the pump as Force Mains.
  • Choose either the Hazen Williams or Darcy-Weisbach coefficient based on your requirements. (This is typically set in SWMM 5 options or InfoSWMM's Run Manager.)

Step 5: Force Main Data 🛤️


Step 6: HGL Plot of the Force Main System 📊


Step 7: Pump Summary 📑

  • Refer to the RPT File to get a comprehensive summary of the pump's performance and other related parameters.

Conclusion: 🌟 Setting up the Pump/Force Main system in InfoSWMM and SWMM 5 is a meticulous process but ensures efficient and effective wastewater management. Following these steps will ensure a robust system in place! 🚀🌊🛠️


Water Quality Processes in a Subcatchment and Node/Link System of SWMM 5

Subject:  Water Quality Processes in a Subcatchment and Node/Link System of SWMM 5

Manhole Elevations in InfoSWMM and SWMM 5

Subject: Manhole Elevations in InfoSWMM and SWMM 5

Starting from the bottom of the manhole you have these regions of computational interest:

1.   Manhole Invert to the lowest link invert – the node continuity equation is used with the area of the manhole being the default surface area of a manhole,
2.   Lowest Link Invert to the Highest Link Crown Elevation – the node continuity equation is used with surface of the node being normally half of the surface area of the incoming and outgoing links,
3.   Highest Manhole Pipe Crown Elevation to Manhole Rim Elevation – the node surcharge algorithm in which the surface area of the manhole is not used and the surcharge depth is iterated until the inflow and the outflows of the node are in balance,
4.   The region above the Manhole Rim Elevation which can use one of four options to calculate the depth and/or flow out of or into the manhole:
1.   No Surcharge Depth is entered and No Ponding area is used – the excess water into the manhole is lost to the network and shows up as internal outflow in the continuity tables,
2.   A Ponding Area is used and the excess flow will  pond on the surface of the manhole and later go back down into the conveyance pipes.
3.   A Surcharge Depth is used and the depth will continue to be calculated using the node surcharge algorithm in which the surface area of the manhole is not used and the surcharge depth is iterated until the inflow and the outflows of the node are in balance,
4.   A Dual Drainage system is simulated and the excess flow of the manhole is simulated in the street gutters or the actual street,
5.   You use a 1D/2D linkage between the 1D manhole and 1D links to a 2D Mesh and simulate the flow out and the flow into the manhole using a bottom outlet orifice that switches automatically between weir and orifice flow based on the depth on top of the manhole. 


This is how you use the batch file in SWMM 5 to make a Report

This is how you use the batch file in SWMM 5 to make a Report 
Step 1:  You make a bat file - here is a sample file that uses the swmm5.exe program 
swmm5.exe Example1.inp  D:\swmm5.0.021\bob.rpt
pause  

Step 2:  Set up the Report Data in the input file

[REPORT]
CONTROLS NO
NODES   ALL
LINKS   ALL

Step 3:  Run the program 

Step 4:  Look at the RPT Output file for the node and link

  <<< Link 14 >>>
  ---------------------------------------------------------------------------------
                             Flow  Velocity     Depth   Percent       TSS      Lead
  Date        Time            CFS    ft/sec      feet      Full      MG/L      UG/L
  ---------------------------------------------------------------------------------
  JAN-01-1998 01:00:00      0.000     0.000     0.000       0.0     0.000     0.000
  JAN-01-1998 02:00:00      0.302     3.835     0.157      15.7    83.361    16.672
  JAN-01-1998 03:00:00      0.648     4.791     0.228      22.8    65.616    13.123
  JAN-01-1998 04:00:00      1.487     6.071     0.350      35.0    50.235    10.047
  JAN-01-1998 05:00:00      1.081     5.559     0.296      29.6    54.180    10.836
  JAN-01-1998 06:00:00      0.410     4.222     0.181      18.1    71.439    14.288
  JAN-01-1998 07:00:00      0.039     2.194     0.057       5.7   144.040    28.808
  JAN-01-1998 08:00:00      0.001     0.000     0.008       0.8     1.282     0.256
  JAN-01-1998 09:00:00      0.000     0.000     0.005       0.5     0.031     0.006
  JAN-01-1998 10:00:00      0.000     0.000     0.004       0.4     0.002     0.000
  JAN-01-1998 11:00:00      0.000     0.000     0.003       0.3     0.000     0.000
  JAN-01-1998 12:00:00      0.000     0.000     0.002       0.2     0.000     0.000
  JAN-01-1998 13:00:00      0.000     0.000     0.002       0.2     0.000     0.000

How to Save Selected Nodes and Links in InfoSWMM

Note:   How to Save Selected Nodes and Links in InfoSWMM

Step 1:  Decide what Nodes and Links you want to save.


Step 2:  You can read the flow, velocity, depth and capacity from the RPT Text File.


How to change the Maximum Infiltration in a DB Table of InfoSWMM and H2OMAP SWMM

Note:  How to change the Maximum Infiltration in a DB Table of InfoSWMM and H2OMAP SWMM

There are a lot of methods in InfoSWMM and H20MAP SWMM to change the infiltration data.  You have the ability to change it for

1.      an individual subcatchment using the Attribute Browser
2.      by soil type and
3.      the coverage of the soil over all of the subcatchments – this will alter the areal weighted average of the infiltration data

You have layers of infiltration data in the interface to your model data.  The infiltration parameters are defined per soil as in a real watershed and the subcatchments will use the areal weighted infiltration values of all of the soils on the subcatchment.  You get more flexibility and closer to the physical reality of the subcatchment by having layers of soil on the subcatchment rather than one set of infiltration per subcatchment.  Of course if you set up one soil type per subcatchment then you will have 100 percent coverage of the same infiltration set of parameters per subcatchment.


Method 1: An Individual Subcatchment by using the Attribute Browser


Method 2: All of the Infiltration Data in the Soil Tables using the DB Editor and the Block Edit command.


Method 3:  You can also change the overall Infiltration by changing the soil coverage of the Subcatchment using the Subcatchment Infiltration table.


AI Rivers of Wisdom about ICM SWMM

Here's the text "Rivers of Wisdom" formatted with one sentence per line: [Verse 1] 🌊 Beneath the ancient oak, where shadows p...