Read the Paul Boulos (CEO/Innovyze) Interview in Spring 2015 Kentucky Engineering Journal http://t.co/mlykEF2yXy pic.twitter.com/6Hu8X0ynar
— Robert Dickinson (@InnovyzeRobert) April 26, 2015
Sunday, April 26, 2015
Read the Paul Boulos (CEO/Innovyze) Interview in Spring 2015 Kentucky Engineering Journal
Friday, April 24, 2015
A Box folder with more complicated SWMM 5 QA QC files
Note: I am going to add more complicated SWMM 5 file to this box location as I made them and find them.
Click on this link
https://app.box.com/s/uhyft6by6sgd0v91znjjv6juxr5v2l2t
Click on this link
https://app.box.com/s/uhyft6by6sgd0v91znjjv6juxr5v2l2t
a
Thursday, April 23, 2015
AAEES 2015 Innovyze Excellence in Computational Hydraulics/Hydrology Award Presented to Carnegie Mellon University Doctoral Student
 |
Press Room | Products | News | Events | The Company
|
AAEES 2015 Innovyze Excellence in Computational Hydraulics/Hydrology Award Presented to Carnegie Mellon University Doctoral Student
|
Broomfield, Colorado, USA, April 23, 2015 — Innovyze, a leading global innovator of business analytics software and technologies for smart wet infrastructure, today announced that Amy Dale, a Ph.D. candidate pursuing a joint degree in the Departments of Engineering and Public Policy and Civil and Environmental Engineering at Carnegie Mellon University, has been chosen to receive the American Academy of Environmental Engineers and Scientists (AAEES) 2015 Innovyze Excellence in Computational Hydraulics/Hydrology Award. Amy’s publications related to her work include a recent Feature article in Environmental Science and Technology.
Among her other achievements, Amy is a national 2010 Udall Scholar, a 2011 ARCS (Achievement Rewards for College Scientists) Scholar, a former NSF IGERT Fellow, and a current EPA STAR Graduate Research Fellow. She received a B.S. in Bioinformatics (summa cum laude) from the University of Pittsburgh in 2011. This prestigious annual award recognizes a student whose research contributes to the knowledge pool in the area of Computational Hydraulics & Hydrology. Selection is based on original, innovative research of publishable quality and other factors. Both Master's and Ph.D. students are eligible. Administered by AAEES and co-sponsored by Innovyze, the award consists of cash honoraria of $1,500 for the student and $500 for the major faculty advisor. A $500 travel allotment is also provided to the student recipient to attend the AAEES Excellence in Environmental Engineering and Science Awards Luncheon. The award selection is administered jointly by a committee consisting of equal members of AAEES and the Association of Environmental Engineering and Science Professors (AEESP). “Innovyze is pleased to present this signal award to Ms. Dale,” said Paul F. Boulos, Ph.D., BCEEM, Hon.D.WRE,Dist.D.NE, Dist.M.ASCE, NAE, President, COO and Chief Technical Officer of Innovyze. “We are proud to further her future in this critical field, and play a small part in her efforts to make the world a better place through her work. On behalf of everyone at Innovyze, enthusiastic congratulations to her.” |
About Innovyze
Innovyze is a leading global provider of wet infrastructure business analytics software solutions designed to meet the technological needs of water and wastewater utilities, government agencies, and engineering organizations worldwide. Its clients include the majority of the largest UK, Australasia and North American cities, foremost utilities on all five continents, and ENR top-rated design firms. With unparalleled expertise and offices in North America, Europe, and Asia Pacific, the Innovyze connected portfolio of best-in-class product lines empowers thousands of engineers to competitively plan, manage, design, protect, operate and sustain highly efficient and reliable infrastructure systems, and provides an enduring platform for customer success. For more information, call Innovyze at +1 626-568-6868, or visit www.innovyze.com.
Innovyze Contact
Rajan Ray
Director of Marketing and Client Service Manager
|
Tuesday, April 21, 2015
How to change the Maximum Infiltration in a DB Table of InfoSWMM and H2OMAP SWMM
How to change the Maximum Infiltration in a DB Table of InfoSWMM and H2OMAP SWMM
There are a lot of methods in InfoSWMM and H20MAP SWMM to change the infiltration data. You have the ability to change it for
1. an individual Subcatchment using the Attribute Browser
2. by soil type and
3. the coverage of the soil over all of the Subcatchments – this will alter the areal weighted average of the infiltration data
You have layers of infiltration data in the interface to your model data. The infiltration parameters are defined per soil as in a real watershed and the Subcatchments will use the areal weighted infiltration values of all of the soils on the Subcatchment. You get more flexibility and closer to the physical reality of the Subcatchment by having layers of soil on the Subcatchment rather than one set of infiltration per Subcatchment. Of course if you set up one soil type per Subcatchment then you will have 100 percent coverage of the same infiltration set of parameters per Subcatchment.

 |
| Method 1: An Individual Subcatchment by using the Attribute Browser |

 |
| Method 3: You can also change the overall Infiltration by changing the soil coverage of the Subcatchment using the Subcatchment Infiltration table. |
Monday, April 20, 2015
Build SWMM 5.1.008 (04/02/2015) New Features with Images
SWMM 5.1.008 (04/02/2015) New Features

1.  Monthly adjustments for hydraulic conductivity used for
    rainfall infiltration and for exfiltration from storage
    nodes and conduits was added.
This was added to the Monthly Adjustments Table
// Data formats are:
//    TEMPERATURE   v1 ... v12
//    EVAPORATION   v1 ... v12
//    RAINFALL      v1 ... v12
//    CONDUCTIVITY  v1 ... v12

2.  LID drains can now send their outflow to a different node
    or subcatchment than the parent subcatchment in which they
    were placed.
drainSubcatch;  // subcatchment receiving drain flow    //(5.1.008)
 drainNode;      // node receiving drain flow                      //(5.1.008)

3.  Conveyance system Outfall nodes now have the option to
    send their outflow onto a subcatchment, to simulate
    irrigation or complex LID treatment options.
        // --- add outfall's flow to subcatchment as runon and re-set routed
        //     flow volume to 0
        subcatch_addRunonFlow(k, Outfall[i].vRouted/tStep);
        massbal_updateRunoffTotals(RUNOFF_RUNON, Outfall[i].vRouted);
        Outfall[i].vRouted = 0.0;

4.  A new LID practice, Rooftop Disconnection, has been added.
    It allows one to explicitly model roof runoff with an
    optional limit on the flow capacity of their downspouts.
    Disconnection is specified by setting the Return To Pervious
    Area field in the [LID_USAGE] section to 1.
 |
8 Types of LID's In SWMM 5,1.008 |
5.  An optional soil layer has been added to Permeable Pavement or Porous Pavment LID's so that a sand filter or bedding layer beneath the
    pavement can be modeled.
 |
| LID Layers in SWMM 5,1,008 |
6.  Several new built-in variable names can now be used in
    custom groundwater flow equations for porosity, unsaturated
    hydraulic conductivity, infiltration rate, and percolation
    rate. See the Help file for more details.
GWvariables {
      gwvHGW,                  // water table height (ft)
         gwvHSW,                       // surface water height (ft)
         gwvHCB,                       // channel bottom height (ft)                 //(5.1.007)
         gwvHGS,                       // ground surface height (ft)                  //(5.1.007)
         gwvKS,                         // sat. hyd. condutivity (ft/s)                    //(5.1.007)
         gwvTHETA,                     // upper zone moisture content         //(5.1.008)
         gwvK,                         // unsat. hyd. conductivity (ft/s)               //(5.1.008)
         gwvPHI,                       // soil porosity                                           //(5.1.008)
         gwvFI,                        // surface infiltration (ft/s)                      //(5.1.008)
         gwvFU,                        // soil percolation (ft/s)                          //(5.1.008)
         gwvA,                         // subcatchment area (ft2)                      //(5.1.008)
         gwvMAX};
7.  A Groundwater Summary table has been added that reports
    several groundwater statistics for each subcatchment.
"\n                                                       Total    Total  Maximum  Average  Average    Final    Final"
"\n                          Total    Total    Lower  Lateral  Lateral       Upper    Water    Upper    Water"
"\n                          Infil     Evap  Seepage  Outflow  Outflow   Moist.    Table      Moist.    Table");

8.  A new option, the Minimum Variable Time Step, was added that
    limits the smallest time step that can be computed under
    variable time stepping for dynamic wave flow routing. In
    previous releases it was fixed at 0.5 seconds which remains
    the default. The smallest value it can now have is 0.001 sec.

"\n Average Maximum Maximum Time of Max Reported"
"\n Depth Depth HGL Occurrence Max Depth");
11. Control rule premises can now contain conditions that compare
the values of a node or link variable at two different locations
(e.g. IF NODE 123 HEAD and NODE 456 HEAD) and node volume was
added as a condition clause variable.
// - Support added for r.h.s. variables in rule premises.
// - Node volume added as a premise variable.
Sunday, April 19, 2015
Modeling of Phosphorus Dynamics in Lake Okeechobee
Modeling of Phosphorus Dynamics in Lake Okeechobee
Here is a downloadable PDF File
Modeling of Phosphorus dynamics of Lake Okeechobee
 Modeling of Phosphorus Dynamics in Lake Okeechobee[/caption]
l Now at WP Software, 8-10 Purdue St., Belconnen, A.C.T. 2617, Australia
2 Now at Dept. of Civil Engineering, Oregon State University, Corvallis, OR 97331-2302
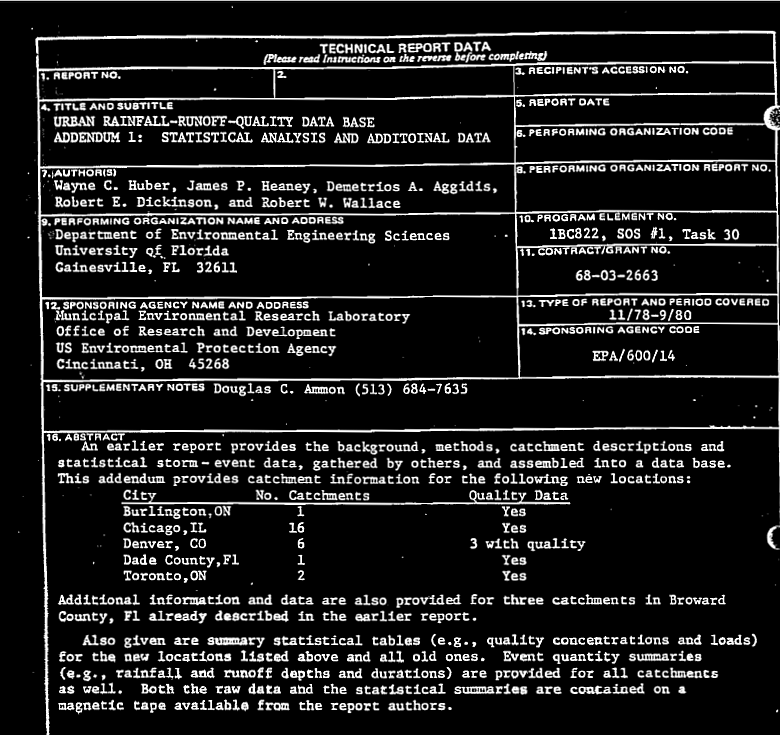
URBAN RAINFALL-RUNOFF-QUALITY DATA BASE ADDENDUM 1: STATISTICAL ANALYSIS AND ADDITIONAL DATA
URBAN RAINFALL-RUNOFF-QUALITY DATA BASE ADDENDUM 1: STATISTICAL ANALYSIS AND ADDITIONAL DATA
A three part PDF file containing data from the 1970's and Early 1980's
A three part PDF file containing data from the 1970's and Early 1980's
 Urban Water Quality DB[/caption]
Urban Rainfall Runoff Quality Database Addendum1_Part3
Urban Rainfall Runoff Quality Database Addendum1_Part2
Urban Rainfall Runoff Quality Database Addendum1
SWMM 4 Manual and PDF File
This is just so I can find this using Google Search in the Future
SWMM 4 Manual and PDF File
swmm4manuals SWMM 4 Manual and PDF File
 SWMM4 Manuals[/caption]
SWMM 3 Manual and PDF File
This is just so I can find this using Google Search in the Future
SWMM 3 Manual and PDF File
SWMM3_Manual
 SWMM 3 Manual and PDF File[/caption]
SWMM 3 Manual and PDF File
SWMM3_Manual
SWMM 3 Manual and PDF File[/caption]Master’s Thesis: Demonstration of Sensitivity Analysis, Uncertainty Analysis, and Calibration in Modelling of a Combined Sewer System Nimmer Zaman Master’s Thesis January 2014
A link to a PDF file showing the Water Quality for ICM and SWMM 5 in a case study in Germany.
Master's Thesis: Demonstration of Sensitivity Analysis, Uncertainty Analysis, and Calibration in Modelling of a Combined Sewer System
Nimmer Zaman
Master’s Thesis
January 2014
Nimmer Zaman Master's Thesis
Master's Thesis: Demonstration of Sensitivity Analysis, Uncertainty Analysis, and Calibration in Modelling of a Combined Sewer System
Nimmer Zaman
Master’s Thesis
January 2014
Nimmer Zaman Master's Thesis
Saturday, April 18, 2015
QA/QC Process for the Import of an XP-SWMM model to InfoWorks ICM
The following section shows how the XP-SWMM file (MyXP.XP) was converted to an ICM 6 model using the ICM SWMM 6 import tools.
The XP-SWMM model was converted to ICM 6 using a combination of the import process in ICM of a SWMM5 input file (MySWMM5File.INP ) and an Extensive QA/QC process using the .XP file of XP-SWMM (MyXP.XP). Figure 1 shows how the file MySWMM5File.INP looks inside of SWMM 5.1. Figure 2 shows the model summary of the file MySWMM5File.INP which was exported in SWMM 5 format from XP-SWMM. Figure 3 shows the Import process in ICM for any SWMM5 file. Figure 4 show how the file MySWMM5File.INP looks like ICM after the Import. Figure 5 shows the element summary in ICM of the imported file MyXP.XP. The number of links, nodes, Subcatchments and diversions match the input file and the summary shown in Figure 2. There are approximately 7000 nodes, links, diversions and Subcatchments in the model.
After import into ICM the imported data was checked using the Network Validation tool (Figure 6). If there were any import errors a log file would have been created. However, all data imported without errors and the log file was blank for ICM 6 import. ICM has many more node and link parameters than in XP-SWMM so there are some validation errors. The validation errors are shown in Figure 7 and are related to the node of ICM needing chamber, ground and flood levels. You can click on the warning message as shown in Figure 8 to bring up the node grid so that the few validation errors can be fixed. As a further check the .XP file was used to check any ICM Validation Messages as shown in Figure 9.
The import tool in ICM does not import the Rainfall or DWF patterns from the SWMM5 file. The hyetographs and DWF patterns have to be separately copied and pasted from the SWMM5 file to the Rainfall Event CSV file and Waste Water Patter CSV file in ICM. Figure 10 shows the DWF Patterns used in the file MySWMM5File.INP . Figure 11 shows the cumulative Rainfall Hyetographs used in the file MySWMM5File.INP . The Rainfall hyetograph have to be converted to rainfall intensity and multiplied by the storm event total as defined in the file MyXP.XP The rainfall totals for the 2, 5, 10, 25, 50 and 100 year storm events are shown in Figure 12. Figure’s 13 and 14 show the DWF Pattern and ICM Rainfall Event corresponding to the values shown in Figures 10 and 11, respectively. The connection between the Pattern and Rainfall CSV files and the imported network in ICM is illustrated in Figure 15.
The XP-SWMM model in SWMM 5 format has many irregular natural channels modeled as prismatic HEC-RAS transects. Figure 16 shows an example transect view. The imported network in ICM has these transects as channels with a shape named after the transect (Figure 17). The channels can be either used as channel in ICM or converted to a River Reach with 2D connection using the ICM Channel/River Reach conversion tool (Figure 18).
- Figure 1. How the MySWMM5File.INP looks inside of SWMM5

The three types of runoff surfaces in the XP-SWMM model are imported with the physical data on the Subcatchment Tab. Examples of the physical data are the slope, width, Subcatchment area and percent imperviousness for each Subcatchment (Figure 19). The Impervious surface with depression storage is imported as a Fixed Runoff Volume Type with a non-zero initial loss and the SWMM Routing Model. The Impervious surface without depression storage is imported as a Fixed Runoff Volume Type with a zero initial loss and the SWMM Routing Model. The pervious surface with depression storage is imported as a Green-Ampt Runoff Volume Type with a non-zero initial loss and the SWMM Routing Model. The three types of runoff surface can be seen on the Runoff Tab of the Subcatchment Grid.
- Figure 2. MySWMM5File.INP File Summary

- Figure 3. The tools use to import the file MySWMM5File.INP to ICM.

- Figure 4. How the file MySWMM5File.INP looks like ICM after Import.

- Figure 5. Summary of the file MySWMM5File.INP after import into ICM.

- Figure 6. The Network Validation Tool checks the imported file for data errors.

- Figure 7. Import Data Errors are shown in Output.

- Figure 8. Click on Warning Message and the location is shown on the screen.

- Figure 9. The XP file was used to check any ICM Validation Messages.

- Figure 10. The DWF Patterns from XP-SWMM as they look in SWMM5

- Figure 11. The Rainfall Hyetograph in XP-SWMM.

- Figure 12. The 2, 5, 10, 25, 50 and 100 year Storm Totals used In XP-SWMM.

- Figure 13. The Copied DWF Patterns from XP-SWMM in ICM.

- Figure 14. The Converted Hyetograph as it looks in the ICM Rainfall Event.

- Figure 15. Imported XP-SWMM Network, Rainfall and DWF Patterns in ICM.

- Figure 16. Prismatic Channel Transects in XP-SWMM.

- Figure 17. Imported Transects from XP-SWMM are Channel Shapes in ICM.

- Figure 18. You can convert the Channels to River Reaches with Banks and 2D connections using the Channel to River Reach Tool.

 |
| Figure 19. The XP-SWMM Hydrology is imported as Fixed or Green-Ampt for Impervious and Pervious Areas. |
Friday, April 17, 2015
SWMM 5.1 Update History - Build 5.1.008 (04/02/2015)
SWMM 5.1 Update History
=======================
--------------------------
Build 5.1.008 (04/02/2015)
--------------------------
Engine Updates:
New Features:
=============
1. Monthly adjustments for hydraulic conductivity used for
rainfall infiltration and for exfiltration from storage
nodes and conduits was added.
2. LID drains can now send their outflow to a different node
or subcatchment than the parent subcatchment in which they
were placed.
3. Conveyance system Outfall nodes now have the option to
send their outflow onto a subcatchment, to simulate
irrigation or complex LID treatment options.
4. A new LID practice, Rooftop Disconnection, has been added.
It allows one to explicitly model roof runoff with an
optional limit on the flow capacity of their downspouts.
Disconnection is specified by setting the Return To Pervious
Area field in the [LID_USAGE] section to 1.
5. An optional soil layer has been added to Permeable Pavement
LIDs so that a sand filter or bedding layer beneath the
pavement can be modeled.
6. Several new built-in variable names can now be used in
custom groundwater flow equations for porosity, unsaturated
hydraulic conductivity, infiltration rate, and percolation
rate. See the Help file for more details.
7. A Groundwater Summary table has been added that reports
several groundwater statistics for each subcatchment.
8. A new option, the Minimum Variable Time Step, was added that
limits the smallest time step that can be computed under
variable time stepping for dynamic wave flow routing. In
previous releases it was fixed at 0.5 seconds which remains
the default. The smallest value it can now have is 0.001 sec.
9.  The dynamic wave routing procedure was parallelized to take
    advantage of multiple processors, making it run several times
    faster. A new option, THREADS, sets the number of parallel
    threads to use, where the default is 1.
10. A new column was added to the Node Depth Summary report table
    that shows the maximum depth recorded at the Reporting Time Step
    so it can be compared to the maximum depth attained over all
    routing time steps also shown in the table.
11. Control rule premises can now contain conditions that compare
the values of a node or link variable at two different locations
(e.g. IF NODE 123 HEAD > NODE 456 HEAD) and node volume was
added as a condition clause variable.
Improvements:
=============
12. When a subcatchment with LID controls receives runon from another
source (e.g., a subcatchment, LID drain or outfall node) the
runon is now distributed only across the non-LID area of the sub-
catchment instead of the full area. If a single LID takes up the
full subcatchment area then the runon is directed onto the LID.
13. Storage node HRT was added to the state variables saved in the
Hot Start file.
14. The threshold value for reporting a non-zero runoff result
was changed from 0.001 cfs to 0.001 inches/hr.
15. The calculation of overall flow routing mass balance was
modified to account for cases where some flow streams, like
total external inflow, are negative.
16. The "Surface Runoff" label in the Runoff Continuity Report was
replaced with "Total Runoff" since the value reported consists
of both surface runoff and LID drain flow.
17. The "Internal Outflow" label in the Flow Routing Continuity
Report was replaced with "Flooding Losses" to improve clarity.
18. The pollutant washoff routines were moved to a new code module
(surfqual.c) and revised to account for the reduction in
pollutant load that results from runoff flow reduction by LID
units.
19. Initial flows for Steady Flow routing are now ignored since they
are not used in the routing calculation and the initial volume
associated with them contributed to system mass balance error.
20. The various types of lateral inflows to conveyance system nodes
are now evaluated at the date/time for the start of the routing
time step instead of at the end of the time step.
21. The final runoff and routing time steps are adjusted to insure
that the simulation's total duration is not exceeded.
22. When evaluating user-supplied math expressions, any NaN (Not a
Number) result (caused by an underflow, overflow or divide by zero)
is set to 0 so that the NaN doesn't propagate through subsequent
calculations.
Bug Fixes:
==========
23. The evaporation rates read from a time series would only change
when a new day was reached (even though values at more frequent
intervals were present) and could cause a run to stop pre-
maturely in some rare cases.
24. The runoff read from a Hot Start file should have been assigned
to a subcatchment's newRunoff property, not to oldRunoff.
25. An indexing bug that caused Hot Start files with snowmelt
parameters to be read incorrectly was fixed.
26. The setting for a non-conduit link read from a Hot Start file
was not being used to initialize the link.
27. A bug in adjusting snowmelt for snow covered area derived from
an areal depletion curve was fixed.
28. Snowmelt should not have been included in the total
precipitation reported for a subcatchment since the snowfall
which produced it was already accounted for.
29. When computing a flow rate through the Drainage Mat of a Green
Roof LID unit, the mat's void ratio was being applied to the
water depth instead of to the mat's area.
30. The state of LID controls was not being considered when
choosing to use the wet or dry runoff time step which sometimes
lead to excessive LID continuity errors.
31. A re-factoring bug that left reporting time in minutes instead
of hours in the detailed LID results file was fixed and results
are now written to the file at each runoff time step where the
state of the LID unit changes.
32. Failure to initialize groundwater evaporation loss to 0 was
causing problems with the reported groundwater mass balance
for subcatchments that had no pervious area.
33. Excessive continuity errors for systems having conduits with
large seepage rates was fixed.
34. Pollutant loss through seepage in conduits and storage nodes was
not being included in the mass balance calculations.
35. Concentrations in conduits and storage nodes were not being
increased to account for loss of water volume when evaporation
was occurring.
36. Premature exiting of the routine that checks for capacity limited
links whenever a non-conduit link was encountered was fixed.
37. A bug in identifying the percent of time that a conduit has either
end full was fixed.
38. A re-factoring bug that prevented surcharged weirs (see Update 5
for 5.1.007) from passing any flow was fixed.
39. A bug in evaluating recursive calls to nodal water quality treatment
functions was fixed.
GUI Updates:
1. The missing July - December column labels were restored on both
the evaporation and wind speed tables in the Climatology Editor.
2. The label "Surface Water Height (Hsw)" in the Groundwater Flow
Editor was changed to "Surface Water Depth" to make clear that
it is the depth of water at the receiving node and not the height
of water above the aquifer bottom (or Hsw as shown in the dialog's
diagram).
3. The label "Channel Bottom Height (Hcb)" also in the Groundwater
Flow Editor was changed to "Threshold Water Table Elev." to make
clear that it is an elevation and not a height above the aquifer
bottom (as Hcb is in the dialog's diagram).
4. A Groundwater Summary table was added to the form that displays
summary results tables.
5. Groundwater upper zone soil moisture and node lateral inflow are
now included in the abridged Hot Start file that the GUI can
produce (using the File | Export | Hot Start File command).
6. The column labels in the various sections of the SWMM input file
generated by the GUI were modified to better match the labels used
to describe the input file format in Appendix D of the Users Manual.
7. A "Route To" field was added to the Outfall Node property editor to
accommodate the new option of allowing outfall nodes to discharge
onto a subcatchment.
8. The Dynamic Wave page of the Simulation Options dialog was modified
to include the new Minimum Routing Time Step option and the new
Number of Threads option.
9. The LID Control Editor was updated to include the new Rooftop
Disconnection LID practice and the option to add a soil layer
to the Permeable Pavement practice.
10. A Drain Outlet field was added to the LID Usage Editor.
11. The conduit Cross Section Editor dialog was enhanced to display
a selectable list of standard size codes and their dimensions for
elliptical and arch pipes.
12. Custom changes made to the Map's Legends are now saved with the
rest of a project's settings in its .ini file.
13. Word wrapping was added to the Title/Notes display in the
Project Browser to make the contents easier to read.
14. Modal dialog message windows now appear centered over the form that
generates them instead of in the middle of the full display screen.
15. The style of all dropdown list boxes was changed to make them more
visually appealing.
Thursday, April 16, 2015
The Hydrology options in Innovyze InfoSWMM/H2OMap SWMM versus Innovyze ICM
The Hydrology options in Innovyze InfoSWMM/H2OMap SWMM and ICM are shown in these mirror images map of the Runoff dialog in InfoSWMM and the Runoff Surface in ICM.
Equivalent features in InfoSWMM and ICM are:
1. SWMM 5 Non Linear Reservoir and SWMM in ICM
2. Snyder Routing
3. SCS UH Routing
4. Various Versions of the Rational Method


Equivalent features in InfoSWMM and ICM are:
1. SWMM 5 Non Linear Reservoir and SWMM in ICM
2. Snyder Routing
3. SCS UH Routing
4. Various Versions of the Rational Method
Via @Boonsri I Don't Make New Year's Resolutions, I Create Processes (And So Should You)

I spent 6 and a half years studying chemical engineering at the University of Florida and the University of Colorado at Boulder, writing out flow charts for industrial processes. Much of my time was spent thinking about oil rigs and pharmaceutical companies.
Earlier…


Here’s a photo of my dad holding me when I was super little outside my childhood home at The University of Florida. Yes, I actually grew up on campus! And the other photo is of me at the pool we always went to.Read about my dad’s obsession with water.
My Dad is Obsessed with Water
He always has been now that I think about it. When I was a little girl living in Gainesville, FL, he would take me down a path less traveled to get to the pool.
We’d walk in the creek and through a tunnel, instead of walking on the sidewalk and on the crosswalk. He showed me that you can make your own rules. Through the daily treks in the creek, I learned that what is important is the adventure that you make for yourself, not the destination.
Watch the Elemental original story here: From Bacteria to Sperm, the Fascinating World of Low Reynolds Number Flows - it is not here, however.
So when my dad wrote this story about his 40 year career as an engineer, it got me thinking about why I decided to work in Jason Butler’s lab at the University of Florida while I was an undergraduate.
Why was I fascinated by water too? Growing up in Florida, with a culture that centers around sunshine and time in the water, I think water just becomes a need like anything else, one that you can definitely take for granted.
As I recall, it was the summer of 2005 and I was working in Butler’s lab, preparing a microfluidic device that would pump DNA through it. I had to get the experiment ready in the chemical engineering department, but would then have to venture out into the 90 degree weather to look at the flow under a microscope. Even though the experiments never quite worked the way I wanted it to, I always thought it was beautiful to watch the green, fluorescent DNA molecules flow through the microfluidic channel that was made specifically for me by a collaborating graduate student. I had access to the powerful confocal microscope, so I could see what was going on in this micro world and what I was seeing at that moment was a molecule that was breaking all rules that I have ever known about the flow of water as seen by my naked eyes. It was as if I was unlocking a world of possibilities in a world that was invisible to the real world and only I could see the phenomena unfold in the dark microscope room.
The fact that molecules flowing under low Reynolds number do not follow the same rules as the rules that govern the world we live in fascinated me. Molecules that move in low Reynolds number required their own set of rules to get around. Thinking about that is what kept me showing up that summer, even though the series of experiments I ran just failed again and again. I had nothing to show for all my hard work, except for experience. I didn’t know this at the time, but that is the whole point in doing anything. I only had to endure the failed experiments for one summer. Many scientists spend 20 or more years investigating a field of science before they begin to find promising results.
Besides my college lab project, there was always something else about the engineering department at UF that I felt a connection to. I practically grew up in the engineering building at UF because my dad was working in the environmental engineering department and would take me there when he needed to use the computers. I never really understood at my young age exactly what he was doing. All I knew was that he was interested in water and computers.
Watch a film I made, after my dad emailed me: “We love you and I hope you find your meaning and your love but you seem to have found your creativity and wisdom.”
After reading my dad’s most recent description of his work, I’m still not entirely sure what he does (just teasing Dad).
But one thing that he said to me always stuck with me: Do what you love to do and you’ll be happy. It wasn’t so much him telling me that as me witnessing him obsessively code the computer and wait for the simulations to take their course throughout the night, often times ignoring his surroundings. While he was in the same room, he seemed to inhabit a different world all together. Except when we went to the pool. His attention seemed to be completely present on walking in the creek to get there and also swimming laps in the pool. Going to the pool was a daily activity. I remember staying in the water so long, my skin got prune-like. In fact, we probably spent more time in the water, then we spent on land together. I’m happy to see that he’s been working on modeling water for 40 years and his interest in it keeps on growing. And that the code keeps getting more and more complex!
So when I published the Elemental original story about Howard Stone, a renown chemical engineering professor at Princeton University, I had this nostalgic feeling because I remembered my time in Butler’s lab. Remember the time I spent preparing experiments so I could study what would happen to DNA when I pumped them through microfluidic devices.
I sent the video story about low Reynolds number to my dad, and he wanted to write about Reynolds number because he is interested in it. He clarified that he wouldn’t scoop me and that he is interested in high Reynolds number, not low Reynolds number which seemed to capture my imagination.
And to think my dad’s interested in water began in high school, when he was just 17 years old. He learned about SWMM in a brochure from the University of Florida and he thought that working on water resources would be a good way to spend his professional career. So in many ways, that brochure influenced my childhood years, as I roamed around the engineering department at UF. But it also influenced my adventures: the creeks I explored, the pools I swam in, and the beaches I visited.
He actually made this to describe his career progression. You can follow my dad @RDickinson or @InnovyzeRobert on Twitter if you want to stay up-to-date on water related issues.
In case you missed it, also check out the Elemental original story about lego microfluidics: This is not here @Boonsri
I’m curious to know how your childhood and college experiences influenced your career and life decisions. Let me know in the comments!
Boonsri Dickinson's Fascinating Journey to the World of Science: A Splash of Adventure and a Spark of Curiosity 🌊💡
By Boonsri Dickinson
Growing up amidst the vibrant campus of the University of Florida, Boonsri Dickinson's life was intertwined with the world of science and engineering from an early age. Her father, a passionate and dedicated engineer, instilled in her a deep fascination for water and its intricate complexities. 💧
Boonsri's childhood was filled with unconventional adventures, venturing through creeks and tunnels instead of sidewalks, guided by her father's belief in creating one's own path. 🌳👣 These escapades instilled in her the importance of pursuing one's passions and embracing the journey, rather than just focusing on the destination. 🗺️
During her undergraduate studies at the University of Florida, Boonsri's fascination with water led her to Jason Butler's lab, where she delved into the mesmerizing world of microfluidics. 🧪💉 There, she encountered the captivating behavior of molecules under low Reynolds numbers, defying the conventional rules of fluid flow. 🔬
Despite the challenges and setbacks she faced in her experiments, Boonsri's fascination with low Reynolds number flows remained unwavering. 🧪🧪 She found beauty in the movement of fluorescent DNA molecules through microfluidic channels, a spectacle visible only under the powerful confocal microscope. 🧬✨
Her father's unwavering dedication to his work, often spending nights coding and simulating water models, further ignited Boonsri's passion for science and engineering. 💻👨💻 She witnessed firsthand his love for his work, which transcended the boundaries of time and space. 🚀
The influence of her father's career extended beyond the lab, shaping Boonsri's childhood adventures, exploring creeks, swimming countless laps, and spending cherished moments by the water. 🌊🏊♀️ These experiences fostered a deep connection to nature and a lifelong appreciation for the wonders of water. 💧
Boonsri's journey to becoming a scientist is a testament to the power of curiosity, perseverance, and the unwavering support of loved ones. 🧠💪💕 Her story reminds us that the path to scientific discovery is often filled with unexpected twists and turns, but it is the unwavering pursuit of knowledge and the passion for unraveling nature's mysteries that drive us forward. 🔍✨
Subscribe to:
Posts (Atom)