An alternative Method
Autodesk Technologist with Information about Stormwater Management Model (SWMM) for watershed water quality, hydrology and hydraulics modelers (Note this blog is not associated with the EPA). You will find Blog Posts on the Subjects of SWMM5, ICM SWMM, ICM InfoWorks, InfoSWMM and InfoSewer.
Thursday, January 27, 2011
Steps in converting a Arc GIS 10 Model to a Arc GIS 9.3 Model in InfoSWMM or InfoSewer
An alternative Method
Monday, January 24, 2011
Friday, January 21, 2011
Cutoff Divider in the SWMM 5 Kinematic Wave Solution
A divider node in the SWMM 5 Kinematic Wave solution will divide the inflow to a node for two downstream links based on three criteria:
1. Cutoff Divider,
2. Tabular Divider, and
3. Weir Divider
The rule for a Cutoff Divider is that the flow up to the Cutoff Flow will flow down the undiverted link and any flow over the cutoff flow will go down the diverted link. If the total inflow to a node the current flow in the undiverted link then the extra flow will go down the diverted link even though the flow in the undiverted link is not equal to the cutoff flow.
 |
| Figure 1. How the Cutoff Divider Works in SWMM 5 |
Thursday, January 20, 2011
Adverse sloped links in SWMM 5 or InfoSWMM
 |
| Figure 1. How Adverse Sloped Links are Treated in SWMM 5. |
Monday, January 17, 2011
Sunday, January 16, 2011
Saturday, January 15, 2011
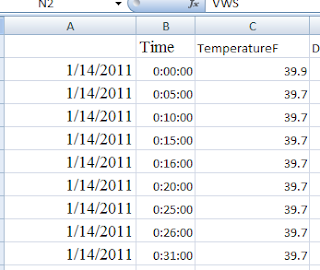
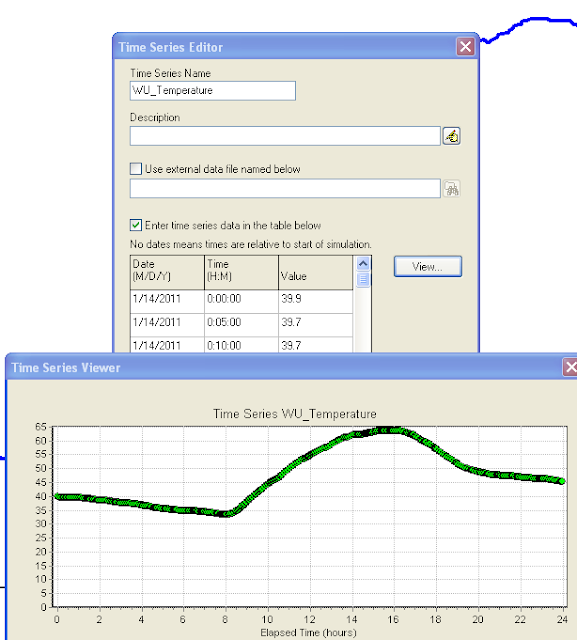
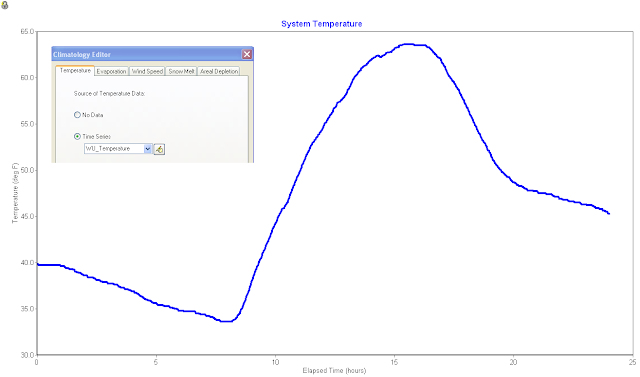
Weather Underground Temperature Data and SWMM 5
 |
| Figure 1. Weather Underground Temperature Data |
 |
| Figure 3. CSV File Exported to Excel |
 |
| Figure 4: Make a SWMM 5 Time Series to Copy and Paste the Temperature from the CSV File. |
Monday, January 10, 2011
Saturday, January 8, 2011
Types of SWMM 5 Curves
There are ten types of curves in SWMM 5.0.021 in seven categories accessible through the Data Tab and the Attribute Browser – including four types of Pump Curves:
- Storage
- Diversion
- Rating
- Tidal
- Control
- Shape
- Pump
- Pump1
- Pump2
- Pump3
- Pump4
 |
| Figure 1: Curve Types in SWMM 5 |
Types of Nodes and Links in SWMM 5 - with Emojis
Subject: 📌 Types of Nodes and Links in SWMM 5
Introduction: 🚀 SWMM 5 is a powerful tool used for simulating the hydrology and hydraulics of urban drainage systems. Central to its modeling capabilities are the nodes and links that constitute the drainage network. Let's delve deeper into understanding these critical components.
Nodes in SWMM 5 📍: Nodes are pivotal points or junctions in the drainage system where water collects and gets distributed. They can be categorized as:
Junctions 🚇: These are points where multiple links come together. They represent the convergence or divergence of flow paths. In SWMM 5, there's only one type of junction, but it plays a crucial role in defining the flow dynamics.
Storages 🛢️: Storages are areas where water is temporarily held before it's released at a controlled rate. In SWMM 5, there are three types of storage:
- Surface Storage: Represents flat areas like ponds.
- Tank Storage: Denotes vertical cylindrical tanks.
- General Storage: A more flexible form that can represent any shape.
Dividers 🚧: Dividers distribute incoming flow into multiple paths. While they can be used in the dynamic wave solution of SWMM 5, they only help divide the flow in the kinematic wave solution. There are four types of dividers in SWMM 5, each with its unique characteristics.
Outfalls 🌊: Outfalls represent points where water exits the system, either into a larger body of water or another system. SWMM 5 offers five types of outfalls, each designed to simulate different outflow conditions.
Links in SWMM 5 ⛓️: Links are the channels or pathways that connect nodes and facilitate the flow of water between them. They include:
Conduits 🚰: These are pipes or channels that transport water between nodes. They can vary in shape, size, and material.
Pumps 🔄: Pumps are devices that move water from one node to another, typically from a lower elevation to a higher one.
Orifices ⚙️: Orifices control the flow of water between nodes based on the opening size and elevation.
Weirs 🌁: Weirs are barriers that redirect or measure flow. They can be sharp-crested, broad-crested, or even compound.
Outlets 🚪: Outlets control the discharge of water from a node based on the depth or head of water.
Conclusion 🌟: Understanding nodes and links in SWMM 5 is paramount for effective modeling. These components are the building blocks of the drainage system, and their accurate representation ensures reliable and meaningful simulation results. 📊🛠️
 |
| Figure 1. Node and Link Objects in SWMM 5 |
 |
| Figure 2: Node Objects in SWMM 5 |
SWMM 5.0.021 has 16 Overall Modeling Objects
SWMM 5.0.021 has 16 Overall Modeling Objects divided into 4 categories:
The objects in the General category can be applied to more than one category. For example, you can simulate pollutants either at a node or at the subcatchment level.
The objects are:
 |
| Figure 1. Modeling Objects in SWMM 5.0.021 |
Friday, January 7, 2011
How to Import a File from SWMM5 toH20MAP SWMM
Step 1: Make a new H2oMAP SWMM Network
 |
| Figure 1. New Network Dialog. |
Step 2: Use the Exchange Tool / Import EPA SWMM 5
 |
| Figure 2. Exchange Tool in H20MAP SWMM |
Step 3: Import your EPA SWMM data file after locating it using the browser. Click on Import.
 |
| Figure 3. Import Dialog in H2OMAP SWMM. |
Step 4: Use the Attribute Browser, DB Editor and Run Manager to see your data and network after import.
 |
| Figure 4. The imported network in H2oMAP SWMM. |
Tributary Area to a Node in InfoSWMM
Here are the steps you neeed to take to calculate the tributary area of a node in InfoSWMM:
Step 1: Use the DB Editor to get the total area in your model using the Data Statistics Tool.
Step 2: Use the Process options in InfoSWMM to ONLY simulate surface runoff and flow routing.
Step 3. Copy the Node name and Total Inflow Volume from the Juntion Summary Output Table to Excel
Step 4: Find the Total Wet Weather Flow during the simulation from the Wet Weather Inflow Row in the Flow Continuity Table.
Dry Weather Inflow 0.000 0.000
Wet Weather Inflow 0.782 0.255
Step 5. Make a new column in Excel to calculate the tributary area.
The Tributary Area of a Node = Total Inflow Volume / Total Wet Weather Flow * Total Subcatchment Area from Step 1.
You will now have the tributary area for each node. You can verify this number = the total tributary area at the outfalls should equal the Total Subcatchment Area from Step 1.
Maximum
|
Maximum
| |||||||
Lateral
|
Total
|
Time
|
of
|
Lateral
|
Total
|
Tributary
| ||
Inflow
|
Inflow
|
Occurrence
|
Volume
|
Inflow
|
Inflow
|
Area
| ||
Node
|
Type
|
CFS
|
CFS
|
days
|
hr:min
|
10^6 gal
|
10^6 gal
|
acres
|
P001
|
JUNCTION
|
5.54
|
10.86
|
0
|
2:27
|
0.1
|
0.255
|
14.74
|
P005
|
JUNCTION
|
2.14
|
7.42
|
0
|
2:26
|
0.039
|
0.155
|
8.96
|
P009
|
JUNCTION
|
5.78
|
5.78
|
0
|
2:25
|
0.106
|
0.106
|
6.13
|
P011
|
JUNCTION
|
0.7
|
0.7
|
0
|
2:34
|
0.01
|
0.01
|
0.58
|
OUTLET
|
OUTFALL
|
0
|
10.84
|
0
|
2:28
|
0
|
0.255
|
14.74
|
AI Rivers of Wisdom about ICM SWMM
Here's the text "Rivers of Wisdom" formatted with one sentence per line: [Verse 1] 🌊 Beneath the ancient oak, where shadows p...
-
@Innovyze User forum where you can ask questions about our Water and Wastewater Products http://t.co/dwgCOo3fSP pic.twitter.com/R0QKG2dv...
-
Subject: Detention Basin Basics in SWMM 5 What are the basic elements of a detention pond in SWMM 5? They are common in our back...
-
Engine Error Number Description ERROR 101: memory allocation error. ...


.png)


