Saturday, November 27, 2010

Making your inactive elements active in different alternative scenarios

Subject: Making your inactive elements active in different alternative scenarios.
Step 1: Open up the Facility Manager and turn off Apply to Active Facility Only, click on Map Selection and then finally the +Add button
Step 2: Select those elements you want to add to the Facililty (they are yellow in this case)
Step 3: Save and then Close the Facility Manager Dialog
Step 4: The Objects should be active now.
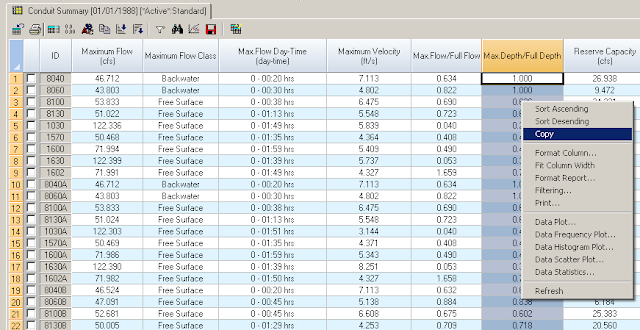
Step 5: Run the Model and check if they are being used in the RPT file.
Step 6: You can also run the Compare Scenario Command to see the different alternative models use a different set of outfalls.

The relationship between the rainfall, total losses from the previous area, evaporation and infiltration only rate in SWMM 5

Subject: The relationship between the rainfall, total losses from the previous area, evaporation and infiltration only rate.
The total loss from a subcatchment pervious area is the sum of the evaporation + infiltration loss. Typically the evaporation rate is much less than the infiltration rate. SWMM 5 now has two options – evaporation during only dry periods or evaporation during both wet and dry periods.
Figure 1: An example network that shows the relationship between the rainfall, total losses from the previous area, evaporation and infiltration only rate.

Figure 2: The same model with the Evaporation during only Dry Periods turned on

How to Determine if your model is Unstable in SWMM 5 or InfoSWMM

Subject: How to Determine if your model is Unstable in SWMM 5 or InfoSWMM
SWMM 5 and InfoSWMM has a good output feature in the RPT file that tells you the list of links with the highest flow instability during the simulation. If you look at the link flow with the highest instability value and it looks okay to you then it usually means the rest of your model output is stable. The index is the number of flow turns for the link during the simulation. A flow turn occurs when
We call DQ the difference between the New and Old flow,
The value of DQ is greater than 0.001 cfs (we do not want to count small perturbations),
The sign difference between the new DQ and the Old DQ is negative. In other words we want to count those oscillations in which the DQ value was negative and is now positive or was positive and is now negative. We don’t count then when the flow is monotonically increasing or decreasing in the link.
For example, the Link U-104 below has a large number of Flow Turns but a plot of the link flow shows the Flow Turns to mainly unimportant.

WARNING 04: minimum elevation drop used for Conduit - What Does this Message Mean?

Subject: WARNING 04: minimum elevation drop used for Conduit - What Does this Message Mean?
This message means that the elevation drop across the link is less than the minimum allowable drop or (0.001 /3.048 meters)
Elevation1 = Link Offset Upstream + Upstream Node Invert
Elevation2 = Link Offset Downstream + Downstream Node Invert
Internally Elevation1 – Elevation2 should be greater than 0.001 /3.048 meters. If it is not then SWMM 5 or InfoSWMM will use the minimum drop or 0.001 /3.048 meters
It simply is a rule that does not allow flat slopes as the flat slopes mean no normal flow calculations. You should not have to worry about this warning message.
Here is an example of a conduit in which the rule is applied. The rule is applied to link U-104 because it is flat and has no slope.

Friday, November 26, 2010

How to Make an Internal Outfall into an External Outfall

Subject: How to Make an Internal Outfall into an External Outfall when you have more than one link connected to an Outfall
Step 1: Identify the Problem “ERROR 141: Outfall J-561 has more than 1 inlet link or an outlet link.” Means you have an outfall node in the middle of your model.

Step 2: Make a new outfall.

Step 3: Make the new Outfall have the same invert as the old outfall

Step 4: Convert the older outfall to a Junction using the Pick Axe and the Convert Type tool


Step 5: Make a new Link connecting the old and the new Outfall

Step 6: Convert the new Link to an Outlet Type using the Convert Type Tool.

Step 7: Set up the parameters for the new Outlet Link


Step 8: For those outfalls that DO have more than one link you need to make a new Outfall.


You should be able to run the model now

How to Make an Internal Outfall into an External Outfall when you have more than one link connected to an Outfall in SWMM5

by dickinsonre
Subject:  How to Make an Internal Outfall into an External Outfall when you have more than one link connected to an Outfall
Step 1:  Identify the Problem "ERROR 141: Outfall J-561 has more than 1 inlet link or an outlet link." Means you have an outfall node in the middle of your model.
Step 2:  Make a new outfall.
Step 3:  Make the new Outfall  have the same invert as the old outfall 
Step 4:  Convert the older outfall  to a Junction using the Pick Axe and the Convert Type tool
Step 5:  Make a new Link connecting the old and the new Outfall
Step 6:  Convert the new Link to an  Outlet Type using the Convert Type Tool.
Step 7:  Set up the parameters for the new Outlet Link
Step 8:  For those outfalls that DO have more than one link you need to make a new Outfall.
You should be able to run the model now

Steps to take and rules for Cloning Datasets in InfoSWMM and InfoSewer

Note: Steps to take and rules for Cloning Datasets in InfoSWMM and InfoSewer
Before cloning an active dataset, the user should switch to the Base Scenario. This saves the active datasets and allows the user to clone the dataset with all edits.


This is a brief description of how datasets are created and saved.
· Any data the user changes are only changed in the Active data sets while the user is working in a given scenario.
· The modified data are not saved into the selected custom data sets until the user selects different data sets—either by selecting a new scenario or by using the Edit Active Scenario command.

If the user changes to a new scenario that shares some of the same data sets (e.g. same pipe, valve and pump data sets), the data in these common data sets are still not updated (saved) by changing scenarios. The user has to actually select a different custom data set of the same type to get the data to update in the custom data set (e.g. the user must select a different pipe set to get the modified pipe data to save into the selected pipe set). Once created, a dataset is not updated (saved) until it is no longer in use by the active scenario.


In addition, there is a fundamental difference in between BASE dataset and other dataset(s).

· The other dataset(s) must be explicitly created first before they can be used.
· BASE dataset will "never" exist until it is switched off from the active scenario.
· It gets implicitly created at the first time when it is released from the active scenario. That is why BASE dataset is never found in a "new" project which has only a base scenario.

Sunday, November 21, 2010

Wikipedia Traffic for THE SWMM versus EPANET Articles

Subject: Wikipedia Traffic for the SWMM versus EPANET Articles
Wikipedia has one article for EPANET and three articles for SWMM 5 (two are redirected to the Stormwater Management Model Main Article). The statistics for the last three years (data before 2007 is unavailable) show an average of 28 visitors per day to SWMM and 16 per day to EPANET). The most common search name has switched from the word SWMM to Stormwater Management Model starting in 2009.

Saturday, November 20, 2010

How to change the Maximum Infiltration in a DB Table of InfoSWMM and H2OMAP SWMM

Note: How to change the Maximum Infiltration in a DB Table of InfoSWMM and H2OMAP SWMM
There are a lot of methods in InfoSWMM and H20MAP SWMM to change the infiltration data. You have the ability to change it for
1. an individual subcatchment using the Attribute Browser
2. by soil type and
3. the coverage of the soil over all of the subcatchments – this will alter the areal weighted average of the infiltration data

You have layers of infiltration data in the interface to your model data. The infiltration parameters are defined per soil as in a real watershed and the subcatchments will use the areal weighted infiltration values of all of the soils on the subcatchment. You get more flexibility and closer to the physical reality of the subcatchment by having layers of soil on the subcatchment rather than one set of infiltration per subcatchment. Of course if you set up one soil type per subcatchment then you will have 100 percent coverage of the same infiltration set of parameters per subcatchment.


Method 1: An Individual Subcatchment by using the Attribute Browser


Method 2: All of the Infiltration Data in the Soil Tables using the DB Editor and the Block Edit command.


Method 3: You can also change the overall Infiltration by changing the soil coverage of the Subcatchment using the Subcatchment Infiltration table.


How to change the background color and data view in InfoSewer and InfoSWMM

Subject: How to change the background color and data view in InfoSewer and InfoSWMM
Tip 1: Use the command View> Data Frame Properties > Frame > Background (change color) to change the background color

Tip 2: Use the command View> Data Frame Properties > Data Frame > Extent to change the default view in Arc GIS. You would use this tool if you have zoom to a small point in InfoSWMM and InfoSewer.

Friday, November 19, 2010

How to Save Selected Nodes and Links in InfoSWMM

Note: How to Save Selected Nodes and Links in InfoSWMM
Step 1: Decide what Nodes and Links you want to save.

Step 2: You can read the flow, velocity, depth and capacity from the RPT Text File.

How to Save Selected Nodes and Linksin InfoSWMM

by dickinsonre
Note:   How to Save Selected Nodes and Links in InfoSWMM

Step 1:  Decide what Nodes and Links you want to save.


Step 2:  You can read the flow, velocity, depth and capacity from the RPT Text File.


This is how you use the batch file in SWMM 5 to make a Detailed Report

Note: This is how you use the batch file in SWMM 5 to make a Detailed Report
Step 1: You make a bat file - here is a sample file that uses the swmm5.exe program
swmm5.exe Example1.inp D:\swmm5.0.021\bob.rpt
pause
Step 2: Set up the Report Data in the input file
[REPORT]
CONTROLS NO
NODES ALL
LINKS ALL
Step 3: Run the program

Step 4: Look at the RPT Output file for the node and link
---------------------------------------------------------------------------------
Flow Velocity Depth Percent TSS Lead
Date Time CFS ft/sec feet Full MG/L UG/L
---------------------------------------------------------------------------------
JAN-01-1998 01:00:00 0.000 0.000 0.000 0.0 0.000 0.000
JAN-01-1998 02:00:00 0.302 3.835 0.157 15.7 83.361 16.672
JAN-01-1998 03:00:00 0.648 4.791 0.228 22.8 65.616 13.123
JAN-01-1998 04:00:00 1.487 6.071 0.350 35.0 50.235 10.047
JAN-01-1998 05:00:00 1.081 5.559 0.296 29.6 54.180 10.836
JAN-01-1998 06:00:00 0.410 4.222 0.181 18.1 71.439 14.288
JAN-01-1998 07:00:00 0.039 2.194 0.057 5.7 144.040 28.808

Link Offset Elevations or Depths in InfoSWMM

Note: Link Offset Elevations or Depths in InfoSWMM
The default offset for all links in InfoSWMM is zero feet or meters. This means that the link is flush with the upstream or downstream node. There is no separation between the invert of the link and the invert of the node. InfoSWMM and SWMM 5 have another option for storing these offsets as absolution elevation. If you use the command Tools/Preferences/Operation Settings then
1. All link offsets will be stored as absolute elevations and not depth offsets. All zero depths will have the proper offset elevation if you check the flag Store Absolute Conduit Invert.
2. The Rim Elevation of the Manholes will be in absolute elevation and not maximum depth if you choose the option Store Absolute Junction Rim.

Thursday, November 18, 2010

InfoSWMM and H2oMAP SWMM Map Display of d/D


Note: You can use the Output Manager in InfoSWMM and H2OMAP SWMM to compute the peak d/D for ALL of the links in your network. Once you have the peak d/D using the tool you can copy them using the command Ctrl-C and paste them to a new field in the Conduit Information DB Table. The pasted mean flow from the Conduit Information table then can be mapped using the Map Display command
Step 1: Use Run Manager and Run the Simulation

Step 2: Use the Output Report Manager and view the Conduit Summary Table

Step 3: Select the links you want to analyze using the pick tool.

Step 4: Copy the Peak d/D values using the command Copy after a Right Mouse Click.


Step 5: Paste the Peak d/D values using the command Paste after a Right Mouse Click in the created DOVERD Field in the Conduit Information DB Table.

Step 6: Map the Conduit.DOVERD variable from the Conduit Information DB Table.

Step 7: Now Display the Peak d/D for each link.

Wednesday, November 17, 2010

Manhole Elevations in InfoSWMM and SWMM 5

Subject: Manhole Elevations in InfoSWMM and SWMM 5
Starting from the bottom of the manhole you have these regions of computational interest:
1. Manhole Invert to the lowest link invert – the node continuity equation is used with the area of the manhole being the default surface area of a manhole,
2. Lowest Link Invert to the Highest Link Crown Elevation – the node continuity equation is used with surface of the node being normally half of the surface area of the incoming and outgoing links,
3. Highest Manhole Pipe Crown Elevation to Manhole Rim Elevation – the node surcharge algorithm in which the surface area of the manhole is not used and the surcharge depth is iterated until the inflow and the outflows of the node are in balance,
4. The region above the Manhole Rim Elevation which can use one of four options to calculate the depth and/or flow out of or into the manhole:
1. No Surcharge Depth is entered and No Ponding area is used – the excess water into the manhole is lost to the network and shows up as internal outflow in the continuity tables,
2. A Ponding Area is used and the excess flow will pond on the surface of the manhole and later go back down into the conveyance pipes.
3. A Surcharge Depth is used and the depth will continue to be calculated using the node surcharge algorithm in which the surface area of the manhole is not used and the surcharge depth is iterated until the inflow and the outflows of the node are in balance,
4. A Dual Drainage system is simulated and the excess flow of the manhole is simulated in the street gutters or the actual street,
5. You use a 1D/2D linkage between the 1D manhole and 1D links to a 2D Mesh and simulate the flow out and the flow into the manhole using a bottom outlet orifice that switches automatically between weir and orifice flow based on the depth on top of the manhole.

Tuesday, November 16, 2010

Water Quality Processes in a Subcatchment and Node/Link System of InfoSWMM and SWMM 5

Subject: Water Quality Processes in a Subcatchment and Node/Link System of SWMM 5

Pump / Force Main System in InfoSWMM and SWMM 5

Subject: Pump / Force Main System in InfoSWMM and SWMM 5
The basic system consists of:
· Wet Well and its associated physical parameters,
· Pump Type
· Defined Pump Curve,
· Downstream Pressure Node and
· Downstream Force Main
Figure 1: The Basic System

Step 1: Wet Well Data
Enter the invert elevation, maximum depth of the Wet Well, the physical shape as either a function or shape table and any evaporation or infiltration.

Step 2: Define the Pump Type
The pump type is defined by a Pump Curve and the On and Off elevations:
The four types of pumps are:
· Volume - Flow
· Depth – Flow
· Head – Flow
· Depth - Flow

Step 3: Define the Pump Curve in the Operation Tab

Step 4: Set a Surcharge or Pressure Depth at the Downstream end of the Pump
Any positive Surcharge Depth in the Node will allow the program during the simulation to keep the node under pressure forcing flow through the Force Main.

Step 5: Force Main Data
Define the downstream pipe(s) from the pump as Force Main conduits with either a Hazen Williams or Darcy-Weisbach coefficient (defined in the SWMM 5 options or the Run Manager of InfoSWMM)


Step 6: HGL Plot of the Force Main System

Step 7: Pump Summary in the RPT File

A Basic InfoSewer Wet Well, Pump and Force Main System

Note: A Basic InfoSewer Wet Well, Pump and Force Main System

A Basic InfoSewer Wet Well, Pump and Force Main System

by dickinsonre
Note:  A Basic InfoSewer Wet Well,  Pump and  Force Main System

Sunday, November 14, 2010

How to Set Up an InfoSWMM 2D Simulation Polygon and Mesh

Subject: How to Set Up an InfoSWMM 2D Simulation Polygon and Mesh
Step 1: Create the 2D Database

Step 2: Verify the Creation of the 2D Database

Step 3: Create the background Simulation Polygon for the 2D simulation

Step 4: Create the Mesh on the 2D Simulation Polygon

Step 5: Run the combination 1D and 2D network

Step 6: Simulating the network uses up to the number of cores on your computer for the 2D flow.

Step 7: 2D plot of the flooded mesh points.

Saturday, November 13, 2010

Drainage Wells or a Vertical Exfiltration Trench

Subject: Drainage Wells or a Vertical Exfiltration Trench in InfoSWMM
Note, this is just one way to model an Exfiltration Trench. The source for the image below is Rice Creek Watershed.
You can make a storage node to simulate the trench with the following characteristics:
· Functional or Shape Curve to describe the shape of the trench,
· Infiltration parameters to simulate the infiltration flow out of the bottom or sides of the trench,

Step 1: Define the shape and geometrical characteristics of the Infiltration Trench

Step 2: Define the soil infiltration characteristics of the trench

Step 3: Run the simulation. The Storage Volume Summary tells you the volume infiltrated and the average outflow.

Step 4: Output Manager will also show the infiltration outflow, the depth and the volume of the infiltration/storage node.

Step 5: Infiltration losses out the side and bottom of the orifice.

Drainage Wells or a Vertical Exfiltration Trench in InfoSWMM

by dickinsonre
Subject:  Drainage Wells or a Vertical Exfiltration Trench in InfoSWMM

Note, this is just one way to model an Exfiltration Trench.  The source for the image below is Rice Creek Watershed

You can make a storage node to simulate the trench with the following characteristics:

·         Functional or Shape Curve to describe the shape of the trench,
·         Infiltration parameters to simulate the infiltration flow out of the bottom or sides of the trench,


Step 1:  Define the shape and geometrical characteristics of the Infiltration Trench


Step 2: Define the soil infiltration characteristics of the trench


Step 3:  Run the simulation.  The Storage Volume Summary tells you the volume infiltrated and the average outflow.


Step 4:  Output Manager will also show the infiltration  outflow, the depth and the volume of the infiltration/storage node.


Step 4:    Infiltration losses out the side and bottom of the orifice.


Weirs in InfoSWMM and SWMM 5

Subject: Weirs in InfoSWMM and SWMM 5
Figure 1 shows the relationship between the weir input data and the upstream and downstream nodes.
· Height,
· Crest and
· Node Invert Elevation
There are four types of weirs and if the weir becomes submerged downstream the Villemonte weir submergence correction is applied (Figure 2). You can have flow reversal across the weir unless you use a Flap Gate for the weir (Figure 3).


Figure 1: Definition of Weir Terms

Figure 2: Villemonte Weir Submergence Correction

Figure 3: Flow Reversal in a Weir

Weirs in InfoSWMM and SWMM5

by dickinsonre

Weirs in InfoSWMM and SWMM5

Subject: Weirs in InfoSWMM
 Figure 1 shows the relationship between the weir input data and the upstream and  downstream nodes.
·         Height,
·         Crest and
·         Node Invert Elevation
 There are four types of weirs and if the weir becomes submerged downstream the Villemonte weir submergence correction is applied (Figure 2).  You can have flow reversal across the weir unless you use a Flap Gate for the weir (Figure 3). 

Figure 1:  Definition of Weir Terms
Figure 2: Villemonte Weir Submergence Correction
Figure 3:  Flow Reversal in a Weir

Multiple Storm Events in InfoSWMM and How to Use them in the Scenario Manager

Subject: How to make Multiple Storm Events in InfoSWMM and How to Use them in the Scenario Manager
Step 1. Make a new Time Series to hold the data points for your new Rainfall Time Series in the Operation Tab of the Attribute Browser.

Step 2. Populate the Rainfall Distribution with a SCS Type II Hyetograph with a 1 inch rainfall total


Step 3. Now Clone the created Rainfall Distribution and make 10, 25, 50 and 100 year storm events each with 1 inches of rainfall in a cumulative distribution.


Step 4. Now use the Block Edit command and convert each of the newly created hyetographs to 4, 7, 10, 15 and 20 inch cumulative rainfall totals from the original 1 inch rainfall total (for example).

Step 5. Now create a Raingage for each of the newly created hyetograph time series using the DB Editor under the Raingage Table in Hydrologic Data


Step 6. Link the Time Series to the new Raingages and define the type (cumulative), units (inches) and hyetograph interval (15 minutes)

Step 7. Make 4 New Scenarios for the different return period hyetographs, the Base Scenario will use the 5 year or 4 inch SCS II rainfall.

Step 8. Use the DataSet Manager and make 4 new Subcatchment DB Tables in which each Subcatchment Set uses a different return period hyetograph.

Step 9. Run the Batch Simulator for all 5 scenarios including the Base Scenario.

Step 10. You can use the Output Report Manager to see the Rainfall for all of the Batch Runs to check if the proper rainfall was used for each Scenario Simulation.

How to make Multiple Storm Events in InfoSWMM and How to Use them in the Scenario Manager

by dickinsonre
Subject:  How to make Multiple Storm Events in InfoSWMM and How to Use them in the Scenario Manager

Step 1.  Make a new Time Series to hold the data points for your new Rainfall Time Series in the Operation Tab of the Attribute Browser.


Step 2.  Populate the Rainfall Distribution with a SCS Type II Hyetograph with a 1 inch rainfall total


Step 3.  Now Clone the created Rainfall Distribution and make 10, 25, 50 and 100 year storm events each with 1 inches of rainfall in a cumulative distribution.


Step 4.  Now use the Block Edit command and convert each of the newly created hyetographs to 4, 7, 10, 15 and 20 inch cumulative rainfall totals from the original 1 inch rainfall total (for example).


Step 5.  Now create a Raingage for each of the newly created hyetograph time series using the DB Editor under the Raingage Table in Hydrologic Data


Step 6.  Link the Time Series to the new Raingages and define the type (cumulative), units (inches) and hyetograph interval (15 minutes)


Step 7. Make 4 New Scenarios for the different return period hyetographs,  the Base Scenario will use the 5 year or 4 inch SCS II rainfall.


Step 8Use the DataSet Manager and make 4 new Subcatchment DB Tables in which each Subcatchment Set uses a different return period hyetograph.


Step 9. Run the Batch Simulator for all 5 scenarios including the Base Scenario.


Step 10.  You can  use the Output Report Manager to see the Rainfall for all of the Batch Runs to check if the proper rainfall was used for each Scenario Simulation.


GitHub code and Markdown (MD) files Leveraging

 To better achieve your goal of leveraging your GitHub code and Markdown (MD) files for your WordPress blog or LinkedIn articles, consider t...