Note: You can use the Output Statistics Manager in InfoSWMM and H2OMAP SWMM to compute the peak d/D for ALL of the links in your network. Once you have calculated the peak d/D using the tool you can copy them using the command Ctrl-C and paste them to a new field in the Conduit Information DB Table. The pasted mean flow from the Conduit Information table then can be mapped using Map Display.
Step 1: Use Run Manager and Run the Simulation

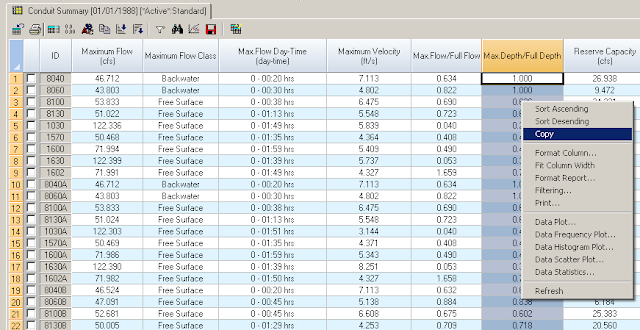
Step 2: Use the Output Report Manager and view the Conduit Summary Table

Step 3: Select the links you want to analyze using the pick tool.

Step 4: Copy the Peak d/D values using the command Copy after a Right Mouse Click.

Step 5: Paste the Peak d/D values using the command Paste after a Right Mouse Click in the created DOVERD Field in the Conduit Information DB Table.

Step 6: Map the Conduit.DOVERD variable from the Conduit Information DB Table.

Step 7: Now Display the Peak d/D for each link.
