Sunday, September 11, 2016

Changing the top of the #EPA #SWMM 5 GUI Window Caption to the current EPA Version using Delphi XE7

If you want to change the top of the EPA SWMM 5 GUI Window Caption and you have access to Delphi XE2 to XE7 (I use XE7 and the EPA GUI uses XE2)  you can change the caption by changing the following line in FMAIN.PAS and recompliing

TXT_MAIN_CAPTION = 'SWMM 5.1.011 - QA/QC';

Figure 1 shows the new GUI top and Figure 2 shows the snippet to be changed in FMAIN.PAS

Figure 2 - New Caption at the Top of the SWMM 5 GUI

Figure 2 - FMAIN.PAS code Snippet

Meaning of Left and Right Bank Station in the Transects of #SWMM5 and #InfoSWMM

Meaning of Left and Right Bank Station in the Transecrts of #SWMM5 and #InfoSWMM

Vertical Roughness in a Pipe In InfoSWMM

Vertical Roughness Threshold-  The Vertical Roughness Threshold is a fraction and
the Threshold depth calculated from this fraction will be the Vertical Roughness
Threshold Fraction * Maximum depth. If the Maximum depth is 3 meters and the Vertical
Roughness Threshold is 0.5 then the dividing depth is 1.5 meters
Vertical Roughness - The lower or higher link roughness is entered as the Vertical
Roughness value

Vertical Roughness in a Pipe In InfoSWMM

Graphical View of the Runoff process in #SWMM5 and #INFOSWMM

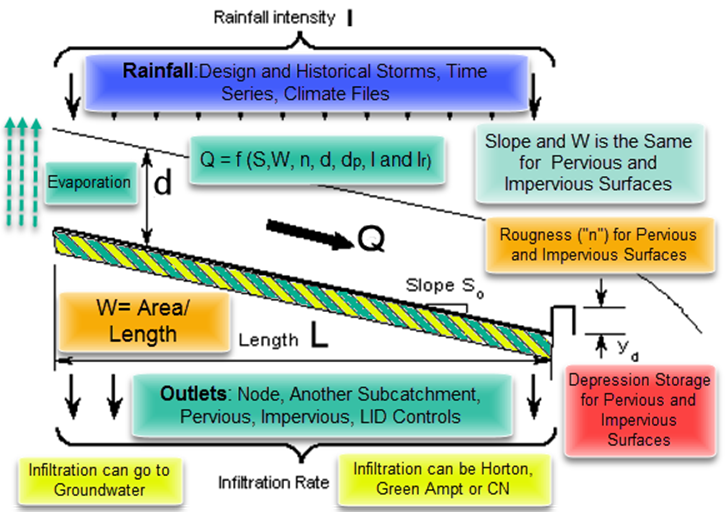
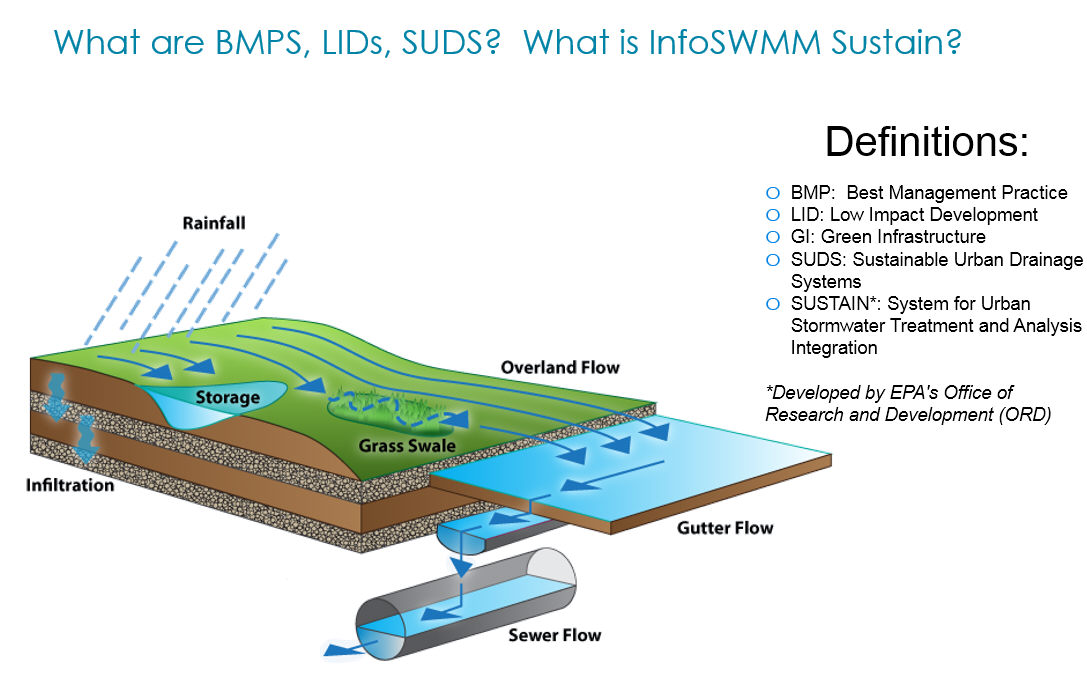
Here is a graphical view of the nonlinear runoff processes in InfoSWMM and SWMM5:
1. Three runoff surfaces
a. Impervious with Depression Storage
b. Pervious
c. Impervious without Depression Storage
2. Slope (same for all runoff surfaces)
3. Width or the Dimension of the Subcatchment (same for all runoff surfaces)
4. Infiltration
a. Horton
b. Modified Horton
c. Green Ampt
d. Modified Green Ampt
e. Curve Number or SCS or CN
f. Monthly Adjustments for Climate Change for all Infiltration Methods
5. Evaporation
a. Constant
b. Time Series
c. Monthly
d. Temperature
e. Climate File
f. Monthly Adjustments for Climate Change
6. Roughness (Manning’s n)
a. Impervious
b. Pervious
7. Depression Storage
a. Impervious
b. Pervious
8. Temperature for Snowmelt
a. Climate File
b. Time Series
c. Monthly Adjustments for Climate Change
9. Wind Speed for Snowmelt
a. Climate File
b. Time Series
10. Other connected processes
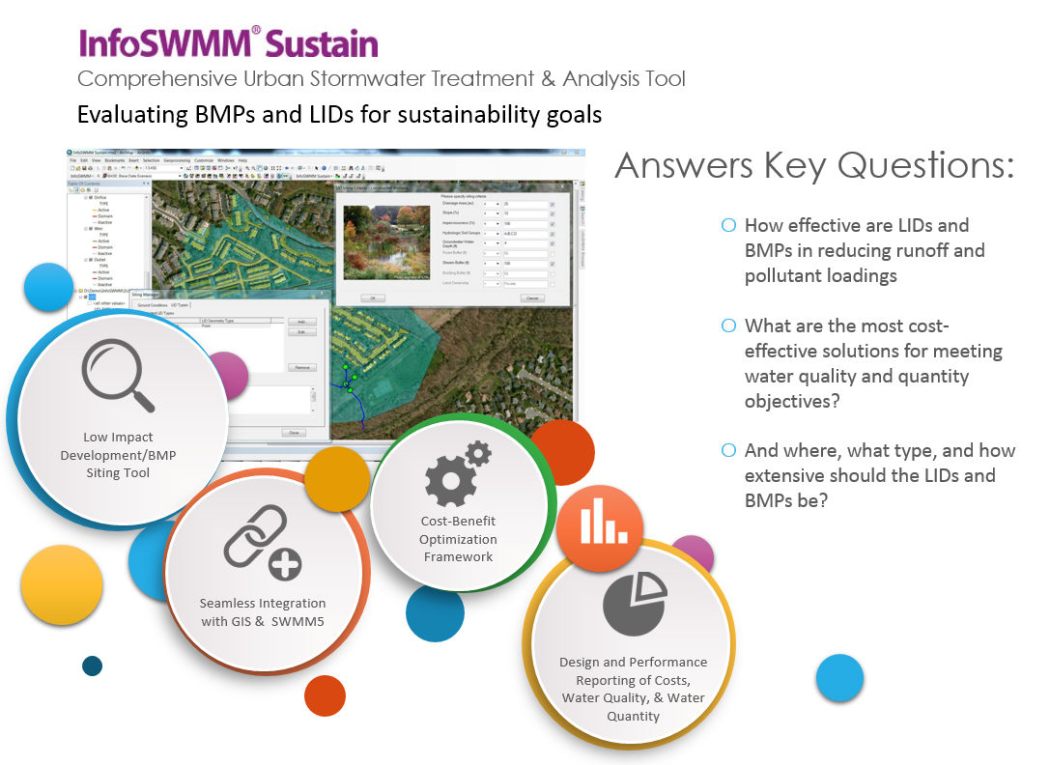
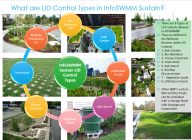
a. LID Controls
b. Groundwater
c. Snowmelt
d. Water Quality
11. Outlet
a. Node
b. Pervious Runoff Surface
c. Impervious Runoff Surface
d. Another Subcatchment
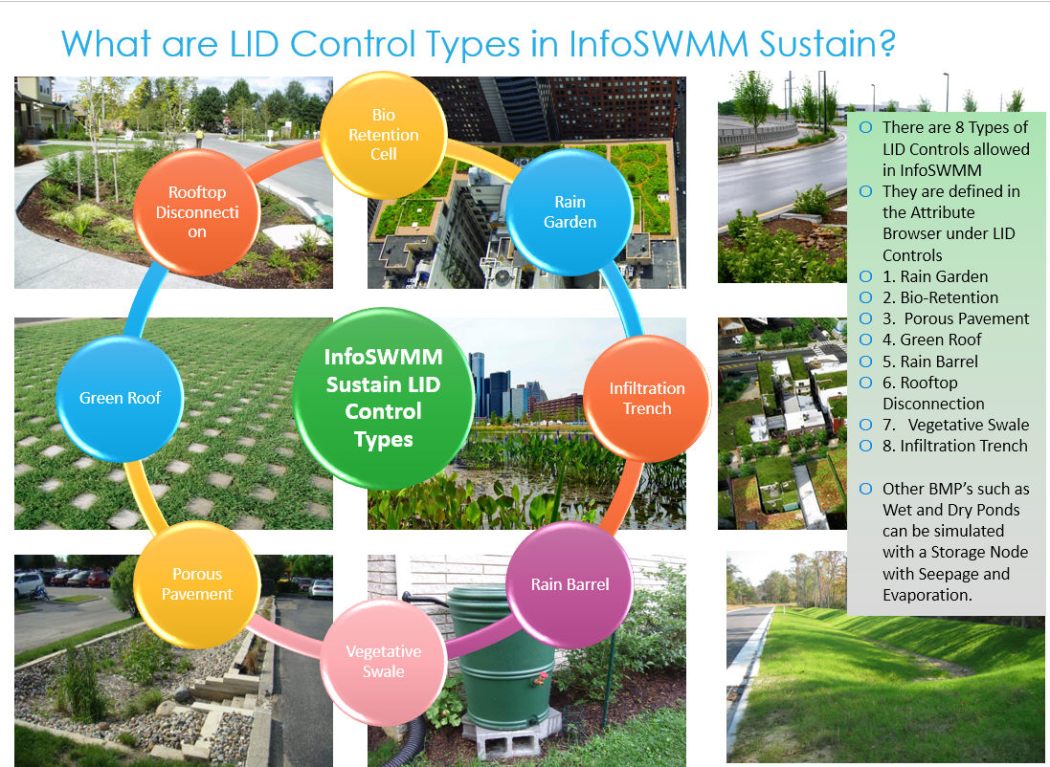
e. LID Controls
i. Rain Garden
ii. Green Roofs
iii. Porous or Permeable Pavements
iv. Bio Retention Cells
v. Infiltration Trench
vi. Vegetative Swales
vii. Rain Barrel
viii. Rooftop Disconnection
12. Rainfall
a. Design Storms
b. Historical Storms
c. Long term NWS data or a Climate File
d. User Time Series
e. Monthly Adjustments for Climate Change

Immerse yourself in the vibrant, non-linear world of runoff processes with InfoSWMM and SWMM5, where every drop of rain and every grain of soil tells a story of hydrological complexity. 🌧️πŸŒΏπŸ”

Explore the Runoff Realm: Your journey begins with the varied landscapes of runoff surfaces, each with its own character:

  • The hard, storage-savvy impervious surfaces πŸ™️
  • The absorbent, life-giving pervious grounds 🌱
  • The slick, unyielding impervious zones without depression storage πŸ›£️

Navigate the Terrain: Traverse slopes identical across terrains and witness how width shapes the subcatchment's hydrological response. 🏞️πŸ“

Infiltrate the Infiltration Puzzle: Decipher the infiltration enigma with methods ranging from Horton to Green-Ampt, each nuanced by climate change's monthly adjustments. πŸ’§πŸ•΅️‍♂️

Evaporation - Nature's Algorithm: Engage with evaporation, nature's algorithm, modulated by constants, series, and even the rhythm of the seasons, all under the watchful eye of climate change. ☀️πŸ’¨

The Roughness Factor: Feel the surface beneath your feet, from the sleek impervious to the textured pervious, each with its unique roughness coefficient. 🚢‍♂️🌳

Depression Storage - Nature's Reservoirs: Discover the pockets of storage across your urban and natural landscapes, critical in the initial interception of rainfall. πŸ›€️🌼

The Chill of Snowmelt: Brace against the chill of snowmelt, guided by temperature readings and wind speeds from climate files or time series, all fine-tuned for a changing world. ❄️🌑️

The Web of Water Processes: Weave through the intricate web of connected water processes, from LID controls that mimic nature to the groundwater's silent flow, the transformation of snow to water, and the dance of water quality constituents. πŸ’¦πŸŒ

Where Waters Flow: Follow the water as it journeys to nodes, pervious surfaces, other subcatchments, or through LID controls like rain gardens and green roofs, each a story of ingenuity and design. 🌈🏞️

The Drama of Rainfall: And finally, gaze skyward to the drama of rainfall, from design storms to historical patterns, enriched by long-term data and user-created sagas, all under the shadow of climate change. 🌦️πŸ“–

This is the mosaic of runoff processes in InfoSWMM and SWMM5—a symphony of hydrological phenomena waiting for you to conduct its performance. πŸŽΆπŸŒπŸ“š

Tips for modeling Force Mains (FM) in #SWMM5, ICM SWMM and #InfoSWMM

Tips for modeling Force Mains (FM) in #SWMM5 and #InfoSWMM


 It often helps to add a break node to a long force main (especially if it joins the Gravity Main (GM) system at the end of the FM):
  1. Adding a Surcharge Node at the end of the Force Main (FM): The implementation of a surcharge node at the end of the force main can be seen as a good modeling practice in hydraulic engineering. This node acts as a buffer or transition point between the pressurized flow in the force main and the gravity-fed flow in the gravity main. By doing so, it allows for the accurate representation of the behavior of flows transitioning from a force main to a gravity main.

  2. The FM has a d/D ratio of 1 most of the time: In hydraulic modeling, the d/D ratio is a representation of the flow depth (d) to pipe diameter (D) ratio. In a force main, the d/D ratio is typically 1, indicating that the pipe is running full. This makes sense because force mains, unlike gravity sewers, are designed to operate under pressure and thus are usually completely filled with the flow. This d/D ratio is a crucial parameter to keep in mind when dealing with force mains and their transition to gravity mains.

  3. Avoiding an abrupt transition between the FM and GM system: The introduction of a surcharge node can help mitigate the potential problems associated with the abrupt transition from the force main (FM) to the gravity main (GM). An abrupt transition can lead to hydraulic issues, such as a sudden drop in flow velocity and potential backflows. These problems can lead to pipe damage or even system failure. The addition of a surcharge node helps to better manage this transition, making the system more resilient to such problems. This practice, therefore, enhances the reliability and efficiency of the combined force main and gravity main system.

By carefully considering these points and strategically incorporating them into the system design, you can effectively mitigate potential issues and ensure a more robust and resilient sewer system operation.


Plotting a Reference Graph in InfoSWMM makes it easy to see how the Pumps react to Wet Well Depths.
FM to GM Transitions 

Break Node in FM's

Saturday, September 10, 2016

A few of the many fantastic features of embedding InfoSWMM inside of ESRI Arc GIS

A few of the many fantastic features of embedding InfoSWMM inside of ESRI Arc GIS is the ability to use the other programs of ESRI such as
  1. magnifying windows, 
  2. Arc Catalog, 
  3. ArcScene 
  4. and having many background maps.
Here are multiple views of InfoSWMM 2D and InfoSWMM Sustain in Arc GIS (Top Image) and ArcScene (Bottom Image).


InfoSWMM 2D in Arc Scene

The Power or Graphics in InfoSWMM and H2OMap SWMM

The Power or Graphics in InfoSWMM and H2OMap SWMM:  The graphs have a lot of flexibility to show, compare and explain your model results.

Monday, September 5, 2016

Example Pump Controls in InfoSewer and H2OMap Sewer

Example Pump Controls in InfoSewer and H2OMap Sewer
Five ways to control the pump by controls in InfoSewerH20Map Sewer. Here are a few examples and important features of the various InfoSewer Pump Controls. A pump in InfoSewerH20Map Sewer uses a Newton-Raphson iteration process for 50 iterations or until the successive iterations between pump flows are 0.001 cfs.
  • Pump volume – control the pump by the pump volume (cubic feet or cubic meters). The on and off settings, pump curve and the iteration process applying to pumps are the controlling simulation features.
  • By Level– control the pump by the pump level or depth ( feet or meters). The on and off settings, pump curve and the iteration process applying to pumps are the controlling simulation features.
  • By Discharge – control the pump by the pump pattern in flow units. The pump pattern (discharge), pump curve and the iteration process applying to pumps are the controlling simulation features. The pump speed adjusts to main the pump pattern.
  • By Inflow – control the pump by the inflow to the Wet Well. The Wet Well inflow, the iteration process applying to pumps are the controlling simulation features. The pump flow equals the inflow to the Wet Well and the Wet Well stays at a constant level.
  • By Time – control the pump by the time speed pattern. The pump curve is used when the pump is turned on by the pattern.

GIF Presentation of LID’s in InfoSWMM Sustain

GIF Presentation of LID’s in InfoSWMM Sustain

This GIF was originally made in Powerpoint and gifmaker.me

How to See the Highest Continuity Errors Table in the Output Report Manager for #InfoSWMM

How to See the Highest Continuity Errors Table in the Output Report Manager for #InfoSWMM
In the output text report file of infoSWMM and H2OMap SWMM there is the Highest Node Continuity Error Table. The Table shows the highest 20 Nodes for percent node continuity errors and the actual continuity error as defined by Node Outflow – Node Inflow. This table is also shown in the Output Report Manger table 
The same value of Node Outflow – Node Inflow is shown in the Junction Summary table under the column flow volume difference. The units of flow volume difference will be the same as the RPT file if the units are changed in the Output Unit Manger.
How to change the volume units in the Output Unit Manger. Change the volume to MG or ML (for SI units).
The flow volume difference can also be seen in Map Display by picking the Active Output variable Vol_Diff or Flow Volume Difference.

Sunday, September 4, 2016

Innovyze InfoSewer vs InfoSWMM and H2OMap SWMM vs H2OMap Sewer

Innovyze InfoSewer vs InfoSWMM and H2OMap SWMM vs H2OMap Sewer
A short comparison of the features in infoSWMM and infoSewer. Many of the same rows apply to H2OMap SWMM and H2OMap Sewer.
Feature ClassFeatureInfoSewerInfoSWMM
Base FunctionalityConservative Solution as an option
Public domain engine
Calibrate model to flow data
Calibration Data
Models siphons
Infers missing inverts
Validation tools
DWF Allocator
Models flow attenuation
RDII flow data processing
Facility Manager
Batch Simulation
Scenario Manager
Scenario Management: Parent-Child Inheritance Functionality
Advanced Reporting (reserve capacity, freeboard, etc)
Data Flagging
Unlimited undo and redo
Version Control: View Commit History, Compare Differences, and Automate Conflict Resolution
IT/Database ArchitectureMulti-User Architecture: (Runs Standalone, in a Workgroup, or as an Enterprise System)
64 Bit Application & Multi Core Processing
Remote Simulation Capability: (Allows user to continue working on model while sim is occuring)
Flexible Licensing: Mix-n-match Model Build and Sim Engine seats as required
2D/Advanced Hydraulic ModelingRiver, Bridge, and Ancillary Modeling
2D IncludedAdd On
True Representation of Open Channels: 1) No limit to x-sections. 2) Full hydraulic interaction with 2D zones along length of channel and over both river banks.HEC-RAS
Superior interaction between rivers, collection systems, and 2D meshes
GPU Card for Increased Sim time and Stability
Shock Capturing (models high velocity flows/steep embankments)
H2OMap SWMM imports H2OMap Sewer and infoSWMM directly
InfoSWMM imports H2OMap SWMM, H2OMap Sewer and InfoSewer directly as shown in the SWMM and Sewer Import Options figure.
A visual comparison between Sewer and SWMM Nodes

AI Rivers of Wisdom about ICM SWMM

Here's the text "Rivers of Wisdom" formatted with one sentence per line: [Verse 1] 🌊 Beneath the ancient oak, where shadows p...