Sunday, December 25, 2022

Graphical View of the Runoff process in #SWMM5 #ICM_SWMM, and #INFOSWMM

 Graphical View of the Runoff process in #SWMM5 #ICM_SWMM, and #INFOSWMM

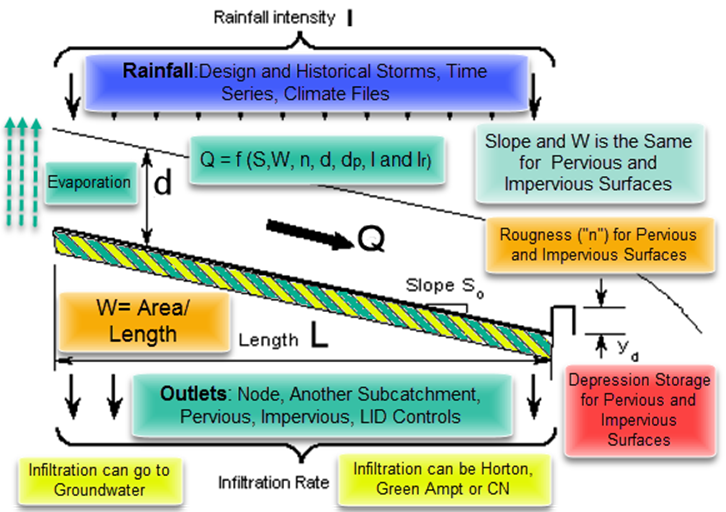
Here is a graphical view of the nonlinear runoff processes in InfoSWMM and SWMM5:
1. Three runoff surfaces
a. Impervious with Depression Storage
b. Pervious
c. Impervious without Depression Storage
2. Slope (same for all runoff surfaces)
3. Width or the Dimension of the Subcatchment (same for all runoff surfaces)
4. Infiltration
a. Horton
b. Modified Horton
c. Green Ampt
d. Modified Green Ampt
e. Curve Number or SCS or CN
f. Monthly Adjustments for Climate Change for all Infiltration Methods
5. Evaporation
a. Constant
b. Time Series
c. Monthly
d. Temperature
e. Climate File
f. Monthly Adjustments for Climate Change
6. Roughness (Manning’s n)
a. Impervious
b. Pervious
7. Depression Storage
a. Impervious
b. Pervious
8. Temperature for Snowmelt
a. Climate File
b. Time Series
c. Monthly Adjustments for Climate Change
9. Wind Speed for Snowmelt
a. Climate File
b. Time Series
10. Other connected processes
a. LID Controls
b. Groundwater
c. Snowmelt
d. Water Quality
11. Outlet
a. Node
b. Pervious Runoff Surface
c. Impervious Runoff Surface
d. Another Subcatchment
e. LID Controls
i. Rain Garden
ii. Green Roofs
iii. Porous or Permeable Pavements
iv. Bio Retention Cells
v. Infiltration Trench
vi. Vegetative Swales
vii. Rain Barrel
viii. Rooftop Disconnection
12. Rainfall
a. Design Storms
b. Historical Storms
c. Long term NWS data or a Climate File
d. User Time Series
e. Monthly Adjustments for Climate Change

Saturday, December 24, 2022

Greetings, and welcome to our stormwater model!

 Greetings, and welcome to our stormwater model! In order to forecast and study the behavior of our stormwater system under a variety of different scenarios, this model has been constructed. It is an essential tool for understanding the effects that storms have on our infrastructure, as well as for planning and putting into action actions to lower the danger of flooding and improve water quality.


The model is derived from a wide variety of data sources, some of which are topographic maps, statistics on land use, precipitation records, and details regarding our stormwater infrastructure. For the purpose of simulating the movement of water throughout the system, it makes use of sophisticated hydrologic and hydraulic modeling techniques. These techniques take into account a variety of factors, including the surface and subsurface flow paths, the capacity of our stormwater pipes and detention basins, as well as the infiltration and evaporation rates of our soils.


We have high hopes that this template will serve as an invaluable tool for our community, and we would be grateful for any comments or suggestions that you might have. We appreciate your interest in our stormwater model. Thank you.

Table comparing and contrasting the features of the Storm Water Management Model (SWMM5) and the EPANET Water Distribution System (WDS)

Table comparing and contrasting the features of the Storm Water Management Model (SWMM5) and the EPANET Water Distribution System (WDS)


FeatureSWMM5EPANET
SubcatchmentsSubcatchments represent the land area that contributes runoff to a stormwater system. They can be specified by size, slope, and land use.Junctions represent the points where pipes connect in a distribution system. They can be specified by demand and elevation.
LinksLinks model the flow of water through a stormwater system. They can be specified by size, material, and roughness coefficient.Pipes model the flow of water through a distribution system. They can be specified by size, material, and roughness coefficient.
JunctionsJunctions model the points where links connect in a stormwater system. They can be specified by elevation and initial water depth.Junctions model the points where pipes connect in a distribution system. They can be specified by demand and elevation.
OutfallsOutfalls model the points where water leaves a stormwater system, such as a stream or river. They can be specified by type and discharge coefficient.Valves are used to control the flow of water in a distribution system. They can be specified by type and setting.
StorageStorage models the volume of water that can be stored in a stormwater system. It can be specified by size, shape, and initial water depth.Reservoirs and tanks are used to model water storage in a distribution system. They can be specified by size and initial water level.
InfiltrationInfiltration models the infiltration of water into the ground,

Tips on how to ensure that your stormwater model is accurate and reliable

Tips on how to ensure that your stormwater model is accurate and reliable:

StepDescription
1. Verify model inputsMake sure that all model inputs (e.g. land use, soil type, precipitation data) are accurate and up-to-date.
2. Calibrate the modelUse observed data (e.g. flow rates, water levels) to fine-tune the model's parameters and ensure that it is accurately predicting system behavior.
3. Validate the modelUse additional observed data to confirm that the model predicts system behavior accurately.
4. Check for model instabilityMonitor the model's output for any sudden or unexpected changes, which may indicate that the model is unstable.
5. Use sensitivity analysisTest the model's sensitivity to changes in key input variables to ensure that it is robust and reliable.
6. Compare with real-world dataCompare the model's predictions with actual measurements from the field to validate its accuracy.

By following these steps, you can help ensure that your stormwater model is a useful and reliable tool for analyzing and predicting the behavior of your system.

Wednesday, December 21, 2022

Horton, Green Ampt and CN Infiltration in a Table Form - with Emojis


Comparing Infiltration Estimation Methods 🌦💧🌱🌍

Infiltration, the process by which water on the ground surface enters the soil, is a vital hydrological phenomenon 🌿💧. Estimating infiltration accurately is paramount for understanding watershed behavior, managing stormwater, and crafting effective water infrastructure 🌊🏞. Here, we'll contrast some leading methods used for estimating infiltration.


🟢 Horton Infiltration Equation vs. Curve Number Method 📊📉

AspectHorton Infiltration Equation 🍀Curve Number Method 🌀
DefinitionAn empirical equation for estimating infiltration based on soil 🌱, antecedent moisture 💧, and potential maximum infiltration rate 🌊A statistical method grounded in soil 🌱, land use 🌆, and hydrologic conditions 🌧
Inputs RequiredSoil type 🌱, antecedent moisture condition 💧, potential maximum infiltration rate 🌊Soil type 🌱, land use 🏞, hydrologic conditions 🌦
UsageDeployed in diverse hydrologic and environmental modeling scenarios 📈Favored for stormwater management systems 🌊 and flood control structures 🚧
AdvantagesSimplicity across a vast range of soil types and conditions 🌿💧Extensively tested and calibrated, based on a vast dataset 📊
LimitationsMay neglect vegetative cover 🌿 or soil compaction impacts on infiltrationCan be imprecise for soils with extreme infiltration rates, may not encapsulate soil moisture's full influence 🌦

🔵 Horton Infiltration Equation vs. Green-Ampt Infiltration Model 🌧💧

AspectHorton Infiltration Equation 🌿Green-Ampt Infiltration Model 🌧
DefinitionEmpirical equation focused on soil type 🌱, antecedent moisture 💧, and potential maximum infiltration rate 🌊Mathematical model revolving around soil moisture content 💧 and hydraulic conductivity 🚰
Inputs RequiredSoil type 🌱, antecedent moisture condition 💧, potential maximum infiltration rate 🌊Data on soil moisture content 💧, hydraulic conductivity 🚰, and effective porosity 🌾
UsageChosen for diverse hydrologic and environmental modeling applications 📈Especially apt for predicting infiltration in unsaturated soils 🌱💧
AdvantagesSimple and versatile across many soil types and conditions 🌿💧Factors in soil moisture's impact on infiltration, adaptable across a spectrum of soil types 🌱💧
LimitationsMay disregard the effect of vegetative cover 🌿 or compaction on infiltrationCan be off the mark for soils with extreme infiltration rates. Requires exact data, sometimes tricky to fetch 📊📉

Each method shines in its own right and presents unique challenges 🌧🌱. The optimal method hinges largely on the specific conditions of the study locale and the data at hand 📊📉. Staying informed about these techniques ensures sound decisions in hydrology and water management 🌊💧🌍.


AI Rivers of Wisdom about ICM SWMM

Here's the text "Rivers of Wisdom" formatted with one sentence per line: [Verse 1] 🌊 Beneath the ancient oak, where shadows p...