#InfoWorks_ICM 7.0 comes with the Clark Unit Hydrograph routing model - see our blog https://t.co/VrcNm9L8qC pic.twitter.com/dt0WaGLxqp— Innovyze (@Innovyze) September 1, 2016
Showing posts with label Innovyze. Show all posts
Showing posts with label Innovyze. Show all posts
Thursday, September 1, 2016
#InfoWorks_ICM 7.0 comes with the Clark Unit Hydrograph routing model
Tuesday, June 21, 2016
Innovyze Releases InfoSWMM Generation V14.5, Spearheading New Era in GIS-Centric Smart Wastewater and Stormwater Modeling
Innovyze Releases InfoSWMM Generation V14.5, Spearheading New Era in GIS-Centric Smart Wastewater and Stormwater Modeling
New Version, Available for Download Immediately, Delivers Unrivaled High-Performance Simulation Capabilities for Unprecedentedly Large Urban Drainage Systems
Broomfield, Colorado, USA, June 21, 2016
In its ongoing quest to equip the wastewater industry with the world’s most comprehensive and innovative smart network modeling and management solutions, Innovyze, a leading global innovator of business analytics software and technologies for smart wet infrastructure, today announced the worldwide availability of the V14.5 Generation of its industry-leading InfoSWMM for ArcGIS (Esri, Redlands, CA). InfoSWMM V14.5 provides unique new capabilities and enhancements that comprise the most advanced approach to guiding and optimizing the planning, design, operation and management of larger and more complex urban drainage systems than ever before, including networks with over one million elements. It delivers many applications for drainage systems in non-urban areas as well.
A complete ArcGIS-centric urban drainage modeling solution, the full-featured InfoSWMM analysis and design program delivers the highest rate of return in the industry. All operations of a typical collection system — from analysis and design to management functions such as water quality assessment, hydrogen sulfide and pollution prediction, sediment transport and deposition, urban flooding, real-time control, and record keeping — are addressed in a single, fully integrated geoengineering environment. It can also accurately represent and analyze any combination of LID controls and green infrastructure to determine their effectiveness in managing stormwater and combined sewer overflows. The program’s powerful hydraulic and water quality computational engine is based on an improved and faster version of the latest USEPA SWMM 5, certified by FEMA. These features and more deliver an enhanced modeling experience and greater realism of displayed results — advantages that translate to increased productivity, reduced costs, higher accuracy, better efficiency, and improved designs.
InfoSWMM also serves as a robust base platform for advanced modeling, operational, short-term and long range planning, capital planning, urban stormwater treatment and analysis, and analytics-driven asset management extensions. Some of these critical applications include InfoSWMM Sustain (optimal selection and placement of green infrastructure), InfoSWMM 2D (two-dimensional surface flood modeling), SWMMLive (real-time urban drainage modeling), CapPlan (risk-based capital planning and asset performance modeling), InfoSWMM SFEM (dynamic sewer flow estimation model), InfoMaster (GIS-centric analytics-driven asset management), and RDII Analyst (rainfall-dependent inflow and infiltration planning and analysis).
The release of InfoSWMM V14.5 extends the capabilities of previous generations with new features, improvements, and groundbreaking innovations in geoengineering productivity and efficiency as well as an enhanced user experience. These advances, requested by our users, greatly simplify, accelerate, and integrate urban drainage network engineering, helping wastewater and stormwater engineers develop better designs and operational improvements faster. The new release includes the ability to skip dry weather or steady-state periods, an important plus for long-term simulations. The user may specify storms of interest while retaining the capability to simulate continuous hydrology, such as seasonal groundwater variations. This functionality allows results files to remain manageable while evaluating a sewer system over a long term period, period of record or typical year analysis. Other enhancements include direct connection to SCADAWatch for model calibration and verification with real-time data, automated export to HEC-RAS, optimized export of very large time series, complete support of 64-bit simulation runs, expanded storage curve calculator to automatically define depths and boundaries of all BMPs, and the ability to expeditiously generate RTK parameters.
“Our priorities have always been to advance the frontiers of smart network modeling technology and support our customers’ successes by helping them be more productive, innovative and competitive —imperative advantages in today’s economy,” said Paul F. Boulos, Ph.D., BCEEM, Hon.D.WRE, Dist.D.NE, Dist.M.ASCE, NAE, President, COO and Chief Innovation Officer of Innovyze. “This major InfoSWMM release delivers on our promise to equip our customers with the ultimate ArcGIS-centric decision support tool for sewer collection and urban drainage systems. Like its predecessors, InfoSWMM V14.5 sets a new standard for quality and high-performance network modeling and management with unrivaled power and speed, cutting-edge capabilities, rich functionality and ease of use. From top to bottom, it is designed for record modeling performance of larger systems than ever, enabling users to increase productivity and quality while achieving engineering, sustainability and business goals. We will continue to work hard to provide our customers with the best GIS-centric modeling solutions to help them design, build, manage and operate safe, sustainable and resilient hydraulic infrastructure systems and drive engineering success.”
Added Robert E. Dickinson, Product Sector Leader for Innovyze, “Improving modeling accuracy and effectively interfacing with GIS applications requires the use of large, detailed operational models of the urban drainage system. With this decisive performance, InfoSWMM has raised the standard of all-element urban drainage network modeling to new levels of reliability, fidelity and performance, giving our customers significant boosts in productivity and efficiencies.”
Pricing and Availability
Upgrade to InfoSWMM V14.5 (and H2OMAP SWMM V14.5) is now available worldwide by subscription. Subscription members can immediately download the new version free of charge directly from www.innovyze.com. The Innovyze Subscription Program is a friendly customer support and software maintenance program that ensures the longevity and usefulness of Innovyze products. It gives subscribers instant access to new functionality as it is developed, along with automatic software updates and upgrades. For the latest information on the Innovyze Subscription Program, visitwww.innovyze.com or contact your local Innovyze Channel Partner.
About InnovyzeInnovyze is a leading global provider of wet infrastructure business analytics software solutions designed to meet the technological needs of water/wastewater utilities, government agencies, and engineering organizations worldwide. Its clients include the majority of the largest UK, Australasian, East Asian and North American cities, foremost utilities on all five continents, and ENR top-rated design firms. With unparalleled expertise and offices in North America, Europe and Asia Pacific, the Innovyze connected portfolio of best-in-class product lines empowers thousands of engineers to competitively plan, manage, design, protect, operate and sustain highly efficient and reliable infrastructure systems, and provides an enduring platform for customer success. For more information, call Innovyze at +1 626-568-6868, or visit www.innovyze.com.
Innovyze Contact:Rajan RayDirector of Marketing and Client Service Manager
Rajan.Ray@innovyze.com
+1 626-568-6868
Rajan.Ray@innovyze.com
+1 626-568-6868
Friday, May 13, 2016
AAEES 2016 Innovyze Excellence in Computational Hydraulics/Hydrology Award Presented to Colorado School of Mines Doctoral Student
 |
Press Room | Products | News | Events | The Company
|
      |
AAEES 2016 Innovyze Excellence in Computational Hydraulics/Hydrology Award Presented to Colorado School of Mines Doctoral Student
|
Broomfield, Colorado, USA, May 13, 2016 — Innovyze, a leading global innovator of business analytics software and technologies for smart wet infrastructure, today announced that Jennifer Jefferson, a Ph.D. student majoring in Hydrology at the Colorado School of Mines working under the supervision of Dr. Reed Maxwell, has been chosen to receive the American Academy of Environmental Engineers and Scientists (AAEES) 2016 Innovyze Excellence in Computational Hydraulics/Hydrology Award. This prestigious annual award recognizes a student whose research contributes to the knowledge pool in the area of Computational Hydraulics & Hydrology. Selection is based on original, innovative research of publishable quality and other factors. Both Master’s and Ph.D. students are eligible.
Ms. Jefferson’s publications include a recent a manuscript titled “Active Subspaces for Sensitivity Analysis and Dimension Reduction of an Integrated Hydrologic Model” published in Computers & Geosciences. The paper has advanced efforts to utilize integrated hydrologic models that are coupled to land surface models. Her research contributions are important because energy transfer into and out of the land surface is a primary driver of climate and weather patterns.
Ms. Jefferson’s research interests center around modeling the impact of land surface disturbances on hydrological processes. Her research has focused on ParFlow.CLM, a parallel coupled terrestrial hydrology simulation platform. She is studying the sensitivity of these models using high resolution simulations running on supercomputing platforms. She is the author of several high impact peer reviewed journal articles.
A professionally registered engineer in Wisconsin, Ms. Jefferson received her B.S. and M.S. degrees in Civil Engineering from Iowa State University. She has served as president of the Colorado School of Mines’ Hydrologic Science and Engineering Club and is a member of the American Geophysical Union, Society of Women Engineers, and American Society of Civil Engineers. In her nomination package, she noted her research has demonstrated that advancing science in her area requires effective collaboration and communication between modelers, mathematicians, engineers and hydrologists.
“I am honored to receive this prestigious award recognizing my Ph.D. work at Colorado School of Mines,” said Ms. Jefferson. “The aspect of my graduate experience that I have enjoyed the most is working with researchers across disciplines and computational work certainly provides a platform for math, hydrology, science and engineering to come together. The research paper submitted as a part of this award fully embodies each of those disciplines, which made it fun to work on!”
Administered by AAEES and co-sponsored by Innovyze, the award consists of cash honoraria of $1,500 for the student and $500 for the major faculty advisor. A $500 travel allotment is also provided to the student recipient to attend the AAEES Excellence in Environmental Engineering and Science Awards Luncheon. The award selection is administered jointly by a committee consisting of equal members of AAEES and the Association of Environmental Engineering and Science Professors (AEESP).
“The Innovyze Excellence in Computational Hydraulics/Hydrology Award is the premier award recognizing exceptional research work in the vital field of computational hydraulics and hydrology,” said Cecil Lue-Hing, D.Sc., P.E., DEE, Hon.D.WRE, Hon.M.ASCE, NAE, President of the Environmental Engineering and Science Foundation. “Ms. Jefferson has demonstrated outstanding academic achievement, exemplary leadership, and a significant commitment to the community at large. We are very pleased to award her this outstanding national recognition, an honor she highly deserves. Her research work is very promising and will have a positive impact on our profession.”
“Innovyze is pleased to present this signal award to Ms. Jefferson,” said Paul F. Boulos, Ph.D., BCEEM, Hon.D.WRE, Dist.D.NE, Dist.M.ASCE, NAE, President, COO and Chief Innovation Officer of Innovyze. “We are proud to further her future in this critical field, and play a small part in her efforts to make the world a better place through her work. On behalf of everyone at Innovyze, enthusiastic congratulations to her.”
About Innovyze
Innovyze is a leading global provider of wet infrastructure business analytics software solutions designed to meet the technological needs of water and wastewater utilities, government agencies, and engineering organizations worldwide. Its clients include the majority of the largest UK, Australasia and North American cities, foremost utilities on all five continents, and ENR top-rated design firms. With unparalleled expertise and offices in North America, Europe, and Asia Pacific, the Innovyze connected portfolio of best-in-class product lines empowers thousands of engineers to competitively plan, manage, design, protect, operate and sustain highly efficient and reliable infrastructure systems, and provides an enduring platform for customer success. For more information, call Innovyze at +1 626-568-6868, or visit www.innovyze.com.
Innovyze Contact
Rajan Ray
Director of Marketing and Client Service Manager
|
Tuesday, May 3, 2016
Oregon’s Clean Water Services Adopts SWMMLive and InfoMaster Technology
Oregon’s Clean Water Services Adopts SWMMLive and InfoMaster Technology
|
Real-Time Sewer Network Modeling and Analytics-Driven Risk-Based Asset Management Software to Improve Business Planning, Infrastructure Sustainability and Resiliency
|
Broomfield, Colorado, USA, May 3, 2016 — Innovyze, a leading global innovator of business analytics software and technologies for smart water infrastructure, today announced that Clean Water Services (District), Oregon, has chosen the company’s industry-leading and award-winning InfoMaster and SWMMLive to support its sanitary sewer capital improvement program. The purchase will enable the District to efficiently upgrade, replace and expand its infrastructure and improve water quality in the Tualatin River and its tributaries.
Headquartered in Hillsboro, Oregon, Clean Water Services is a water resources management utility that combines science and nature to clean water and return it to the Tualatin River so it can be used again. The District cleans more than 60 million gallons of wastewater each day for more than 560,000 customers in urban Washington County. The wastewater is collected by a vast network of more than 800 miles of sewer pipes and 40 pump stations and routed to one of four treatment facilities: Durham, Rock Creek, Hillsboro and Forest Grove. The District also maintains 670 miles of storm sewers and pipelines, open ditches, stormwater detention ponds and water quality facilities.
“As the region’s water resources management utility, everything we do at Clean Water Services aims to protect public health while enhancing the natural environment,” said Wade Denny, P.E., Senior Engineer in the District’s Conveyance Department. “SWMMLive and InfoMaster will help us effectively optimize our sewer rehabilitation program and improve our system efficiency, resiliency and operational performance so we can continue to best serve our customers and protect the environment.”
SWMMLive combines the comprehensive urban drainage modeling capabilities of InfoSWMM, including water quality assessment, pollution prediction, urban flooding, green LID and BMP alternatives, and real-time control, with sophisticated real-time operational forecasting, early warning and emergency management. This powerful risk assessment and real-time decision making tool allows utilities of all sizes to operate and manage their collection systems more efficiently and effectively than ever before. It enables managers and operators to consider the influence of a full range of catchment factors in three key areas: management of flooding and reduction of unregulated discharges; optimization of storage, green alternatives and existing infrastructure, leading to savings on capital works; and optimization of pumps to lower energy costs and reduce CO2 emissions.
Certified by NASSCO PACP, MACP and LACP, InfoMaster is the leading ArcGIS-centric software choice for utilities faced with rehabilitating, strengthening and optimizing their water infrastructures. It can accurately estimate both the likelihood and consequence of failure for each individual water main in the network. It can also evaluate their aging processes, estimating their lifetimes and their structural and functional failure potential and distribution over time. This critical information greatly assists utilities in assessing their pipes’ propensity to fail, identifying those more prone to failure, prioritizing their inspection and determining rehabilitation requirements. InfoMasterfacilitates a proactive approach to identifying and managing these high-risk assets to help preserve structural integrity and keep the network operating well into the future. It also eliminates reactive maintenance: waiting for pipe failures to occur before repairing. This proactive “fix before break” approach can help utilities extend the useful life of their assets and improve their performance at maximum savings.
“Progressive utilities all over the world continue to recognize the benefits of Innovyze advanced geocentric smart water network modeling and management technology,” said Paul F. Boulos, Ph.D., BCEEM, Hon.D.WRE, Dist.D.NE, Dist.M.ASCE, NAE, President, COO and Chief Technical Officer of Innovyze. “The remarkable success of InfoMasterand SWMMLive is due to their combination of powerful advantages: proven capabilities, a rich features set, state-of-the-art optimization, seamless GIS data exchange capabilities, a short learning curve and an unparalleled track record of successful global implementation. All these factors set them apart from the competition by enabling users to complete better, more reliable and cost-effective projects faster than ever before, with a whole new level of interactivity. This gives them an unbeatable competitive advantage and helps them to thrive. The fact that progressive utilities like Clean Water Services continue to choose Innovyze as their solution partner clearly demonstrates the superiority of our products. We’re very proud to know that our software applications are in place at many of the world’s best-run utility companies of every size, helping them meet their corporate and strategic goals and achieve world-class performance at breakthrough cost savings.”
About Innovyze
Innovyze is a leading global provider of wet infrastructure business analytics software solutions designed to meet the technological needs of water and wastewater utilities, government agencies, and engineering organizations worldwide. Its clients include the majority of the largest UK, Australasia and North American cities, foremost utilities on all five continents, and ENR top-rated design firms. With unparalleled expertise and offices in North America, Europe, and Asia Pacific, the Innovyze connected portfolio of best-in-class product lines empowers thousands of engineers to competitively plan, manage, design, protect, operate and sustain highly efficient and reliable infrastructure systems, and provides an enduring platform for customer success. For more information, call Innovyze at +1 626-568-6868, or visit www.innovyze.com.
Innovyze Contact
Rajan Ray
Director of Marketing and Client Service Manager
|
Tuesday, April 19, 2016
Dr. Paul Boulos Presents Agreement of Cooperation between American Society of Civil Engineers and Federation of Lebanese Engineers
Dr. Paul Boulos Presents Agreement of Cooperation between American Society of Civil Engineers and Federation of Lebanese Engineers
Momentous Accord Between Leading Engineering Organizations Promotes Cooperation and Shared Activities
Broomfield, Colorado, USA, April 19, 2016
With the goal of promoting mutual cooperation and shared activities, the American Society of Civil Engineers (ASCE) and the Federation of Lebanese Engineers (FLE) signed an Agreement of Cooperation (AOC), officially establishing communication and joint activities between the two preeminent engineering organizations.
Representatives at this auspicious occasion included Mr. Khaled Chehab, FLE President; Dr. Abdulmenhem Alameddine, Past Vice President of FLE and Vice President of the World Federation of Engineering Organizations; Dr. Makram Suidan, M.ASCE, Dean of Engineering at the American University of Beirut and ASCE Lebanon Section President; the Honorable Ambassador Theodore Kattouf, President and CEO of AMIDEAST; and Dr. Paul Boulos, ASCE Distinguished Member and President of Innovyze.
The meeting with FLE was a follow-up to the ASCE presidential visit to Lebanon last June, when ASCE’s then-President Dr. Robert D. Stevens, P.E., F.ASCE and Dr. Paul Boulos held discussions with the leadership of FLE and ASCE Lebanon Section. ASCE and FLE have entered into this Agreement to facilitate the enhancements of the efforts of each organization to better serve the public and the engineering profession in its own country.
“This accord with ASCE is another major step forward for our Federation,” said Dr. Alameddine. “I look forward to a long-term relationship between our two prominent engineering societies dedicated to supporting our members, advancing our mutual goals, exchanging new technologies and information, and enhancing our noble profession.”
In 2013, ASCE formed an International Group in Lebanon with the support and assistance of the local Federation of Lebanese Engineers, becoming a Section in July 2015. Currently the group has more than 900 members with a large active contingent of students.
Founded in 1852, ASCE is the nation’s oldest engineering society. It represents more than 150,000 members of the civil engineering profession in 177 countries.
“ASCE is proud to be a signatory to the Agreement of Cooperation with the Federation of Lebanese Engineers,” said Mr. Thomas W. Smith III, ENV SP, CAE, F.ASCE, ASCE’s Executive Director. “We look forward to a long and productive relationship between the Federation of Lebanese Engineers and the American Society of Civil Engineers, including further discussions about an international conference or other activities in Lebanon.”
Dr. Boulos added, “It was such an honor for me to present this milestone AOC on behalf of ASCE and to know that our successful cooperation with FLE will now offer members of both engineering organizations even greater opportunity and benefits. I believe this agreement will do even more to help both ASCE and FLE support their members and enhance the engineering profession.”
About InnovyzeInnovyze is a leading global provider of wet infrastructure business analytics software solutions designed to meet the technological needs of water/wastewater utilities, government agencies, and engineering organizations worldwide. Its clients include the majority of the largest UK, Australasian, East Asian and North American cities, foremost utilities on all five continents, and ENR top-rated design firms. With unparalleled expertise and offices in North America, Europe and Asia Pacific, the Innovyze connected portfolio of best-in-class product lines empowers thousands of engineers to competitively plan, manage, design, protect, operate and sustain highly efficient and reliable infrastructure systems, and provides an enduring platform for customer success. For more information, call Innovyze at +1 626-568-6868, or visit www.innovyze.com.
Innovyze Contact:Rajan RayDirector of Marketing and Client Service Manager
Rajan.Ray@innovyze.com
+1 626-568-6868
- See more at: http://www.innovyze.com/news/1673/#sthash.E3J9fHIq.dpufRepresentatives at this auspicious occasion included Mr. Khaled Chehab, FLE President; Dr. Abdulmenhem Alameddine, Past Vice President of FLE and Vice President of the World Federation of Engineering Organizations; Dr. Makram Suidan, M.ASCE, Dean of Engineering at the American University of Beirut and ASCE Lebanon Section President; the Honorable Ambassador Theodore Kattouf, President and CEO of AMIDEAST; and Dr. Paul Boulos, ASCE Distinguished Member and President of Innovyze.
The meeting with FLE was a follow-up to the ASCE presidential visit to Lebanon last June, when ASCE’s then-President Dr. Robert D. Stevens, P.E., F.ASCE and Dr. Paul Boulos held discussions with the leadership of FLE and ASCE Lebanon Section. ASCE and FLE have entered into this Agreement to facilitate the enhancements of the efforts of each organization to better serve the public and the engineering profession in its own country.
“This accord with ASCE is another major step forward for our Federation,” said Dr. Alameddine. “I look forward to a long-term relationship between our two prominent engineering societies dedicated to supporting our members, advancing our mutual goals, exchanging new technologies and information, and enhancing our noble profession.”
In 2013, ASCE formed an International Group in Lebanon with the support and assistance of the local Federation of Lebanese Engineers, becoming a Section in July 2015. Currently the group has more than 900 members with a large active contingent of students.
Founded in 1852, ASCE is the nation’s oldest engineering society. It represents more than 150,000 members of the civil engineering profession in 177 countries.
“ASCE is proud to be a signatory to the Agreement of Cooperation with the Federation of Lebanese Engineers,” said Mr. Thomas W. Smith III, ENV SP, CAE, F.ASCE, ASCE’s Executive Director. “We look forward to a long and productive relationship between the Federation of Lebanese Engineers and the American Society of Civil Engineers, including further discussions about an international conference or other activities in Lebanon.”
Dr. Boulos added, “It was such an honor for me to present this milestone AOC on behalf of ASCE and to know that our successful cooperation with FLE will now offer members of both engineering organizations even greater opportunity and benefits. I believe this agreement will do even more to help both ASCE and FLE support their members and enhance the engineering profession.”
About InnovyzeInnovyze is a leading global provider of wet infrastructure business analytics software solutions designed to meet the technological needs of water/wastewater utilities, government agencies, and engineering organizations worldwide. Its clients include the majority of the largest UK, Australasian, East Asian and North American cities, foremost utilities on all five continents, and ENR top-rated design firms. With unparalleled expertise and offices in North America, Europe and Asia Pacific, the Innovyze connected portfolio of best-in-class product lines empowers thousands of engineers to competitively plan, manage, design, protect, operate and sustain highly efficient and reliable infrastructure systems, and provides an enduring platform for customer success. For more information, call Innovyze at +1 626-568-6868, or visit www.innovyze.com.
Innovyze Contact:Rajan RayDirector of Marketing and Client Service Manager
Rajan.Ray@innovyze.com
+1 626-568-6868
Monday, February 29, 2016
Infosessie nieuwste trends & tools drinkwater producten Innovyze #INFOWATER
Infosessie nieuwste trends & tools drinkwater producten Innovyze #INFOWATER

“SCADAWatch equips us with real-time operational and predictive analytics” Analytics that help us make faster and more confident decisions for optimal performance of our water distribution system. They give us a comprehensive view into the performance of our water systems and enable us to improve operational decisions and better manage risks with information to make decisions about asset renewal and rehabilitation. As a component of the District’s Asset Management Plan, SCADAWatch is envisioned to reduce cost to customers while maintaining required customer service levels."
“InfoWater is a critical component of our Twenty-Year Master Plan” The software’s comprehensive hydraulic and water quality modeling and simulation capabilities and its seamless GIS integration will help us improve our water system efficiency and performance, and ensure that we continue to best serve our customers."
Friday, February 19, 2016
How old are U.S. water pipes? Old, but each city a different story. See the distribution of pipe ages
2/ How old are U.S. water pipes? http://www.circleofblue.org/waternews/2016/world/infographic-the-age-of-u-s-drinking-water-pipes-from-civil-war-era-to-today/ … see #INFOMASTER #WATER for help
1/ ht @waltonwater How old are U.S. water pipes? Old, but each city a different story. See the distribution of pipe ages

Saturday, February 6, 2016
Innovyze RDII Analyst for the Analysis and Calibration of RDII, DWF, DWF Patterns and GWI in Sewer Collection Systems
One of the most powerful InfoSWMM, InfoSWMM SA and H2OMAP SWMM Application Tools from Innovyze is RDII Analyst. RDII Analyst will separate out the Groundwater base flow, Dry Weather Flow (DWF), DWF Patterns, estimate the Wet Weather flow component or RDII Rainfall -Derived Infiltration Inflow (I&I) and use a Genetic Algorithm to find the best fit 12 RTK parameters for RDII modeling. This powerful tool can be used for RTK flow in InfoSWMM, H2OMAP SWMM, InfoSewer, SWMM 5 and InfoWorks ICM. Figure 1 shows one of the end results of RDII Analyst – a correlation plot of Observed versus Calibrated RDII Volume for the simulated events.
RDII Analyst is a significant improvement over the EPA SSOAP program, performs QA/QC of rainfall and flow monitoring data and decomposes the flow data into Dry-Weather Flow (DWF) and Wet-Weather Flow (RDII) components using criteria such as rainfall threshold. The DWF component is further analyzed to construct a DWF pattern that can be used to simulate the collection system using InfoSWMM. The DWF pattern is then assigned to the source nodes that contribute DWF to the meter location in proportion to sewershed areas or based on other criteria. The RDII component is then analyzed to determine RDII events and to calibrate parameters of the RTK synthetic unit hydrograph so that the RDII flow simulated by the RTK method closely matches the RDII flow obtained by the decomposition process. The RTK unit hydrograph parameters are calibrated with genetic algorithm optimization. The calibrated RTK parameters and the DWF patterns are then passed to InfoSWMM to carry out detailed dynamic flow routing through the sewer system and evaluate system response to support the development of an optimal capital improvement program. You can read the World Environmental and Water Resources Congress paper by Misgana and Boulos (2008) with a complete description and validation of the RDII Analyst workflow process for both RDII Analyst and for the InfoSWMM Calibrator Add-On in the InfoSWMM Suite (Boulos, 2005)
- Figure 1. Correlation plot of Observed versus Calibrated RDII Volume for the simulated events.


The steps in using RDII Analyst are both simple and powerful, the main steps are:
- Import flow monitoring data and rainfall data into RDII Analyst
- Perform QA/QC for the flow data and the rainfall data
- Determine dry day flows and create hourly DWF pattern for weekend and weekdays
- Determine the groundwater flow component of the dry days flows
- Determine RDII flow time series
- Identify RDII events, and perform linear regression analysis on the RDII depth and rainfall depth calculated for each RDII event
- Run Genetic Algorithms based calibration of the RTK hydrograph parameters and review calibration results
- Export the DWF patterns, the GWF time series and the calibrated RTK parameters to InfoSWMM
In this overview of the steps in the remainder of the blog post, you’ll learn how the RDII Analyst tool works in general and what terminology is used to describe each step. This is recommended reading for anyone who is new to RDII Analyst. If you are experienced in RDII decomposition, you can probably just skim it when needed.
Step 1. Define the Flow and Rainfall Data
The flow and rainfall data are imported by each monitored Node location. The flow and rainfall format are defined along with the monitored data time intervals. The rainfall and flow do not have to be at the same interval or cover exactly the same time period. The Flow Data Tab displays the flow data that has been read from the flow data file. The display consists of the data area showing Date Time and Value field that is read from the data file. The Rainfall Data Tab displays the flow data that has been read from the rainfall data file. The display consists of the data area showing Date Time and Value field that is read from the data file.
- Figure 2. Imported Flow Data in RDII Analyst

- Figure 3. Imported Rainfall Data in RDII Analyst

Step 2. DWF Extraction
The DWF Mean and Patterns are extracted from the Flow Time Series and the residual is used as the basis of the RTK parameter estimation. The dry day flows identified for weekdays and the weekend are further analyzed to determine hourly DWF patterns that can be used to model DWF in InfoSWMM . The DWF pattern presents average hourly DWF values across all dry days for both weekdays and weekend. The DWF pattern is given both graphically and in report form as shown below. The DWF patterns can be exported to InfoSWMM and are assigned to nodes that contribute flow to the meter location proportional to sewershed area or equally among all nodes.
Once determined, the dry days flows are presented both in report form and in graph form for weekend and for weekdays as shown below. The graph shows average daily flow for each dry day, and upper bound and the lower bounds. The upper bound refers to mean flow of all dry day flows plus standard deviation multiplier *standard deviation of dry day flows. The lower bound refers to mean flow of all dry day flows minus standard deviation multiplier *standard deviation of dry day flows. The bounds help the user visually identify outliers and, if necessary, discard those days from further consideration.
- Figure 4. Define the Methods used in the DWF Extraction.

- Figure 5. Mean and QA/QC Graph for the DWF Extraction.

- Figure 6. DWF Pattern found by RDII Analyst

- Figure 7. Estimated Weekly GroundWater Flow.

Step 3. Ground Water Base Flow Extraction
The DWF Mean and Patterns are extracted from the Flow Time Series and the residual is used as the basis of the RTK parameter estimation. As part of the DWF Extraction, the GW flow can be estimated and later exported to InfoSWMM and a Time Series (Figure 7). The groundwater flow time series can be exported to InfoSWMM as external inflow and can be assigned to nodes that contribute flow to the meter location proportional to sewershed area or equally among all nodes.
Step 4. Export DWF Pattern and DWF Means to the Domain in InfoSWMM
Assign DWF Pattern: This tool assigns the hourly DWF patterns developed for weekdays and weekends to InfoSWMM nodes that contribute flow to the monitoring site. The DWF pattern is allocated to the contributing nodes either proportional to sewershed area of each contributing node, or simply equally among all contributing nodes. The user must assign an ID to be used as the weekday and weekend pattern name. The assignment could be limited to nodes in a domain by checking the Assign to Domain Nodes option.
- Figure 8. Export Dialog to export the DWF means and DWF patterns to the Node DWF DB Table or the Patterns DB Table in InfoSWMM.

Step 5. Create the RDIII or Wet Weather Time Series
RDII flow is the difference between the corrected monitoring flow data, and the sum of average hourly DWF pattern and the groundwater flow time series. Once the hourly DWF pattern and the groundwater flow components are identified, the sum of the two components would be subtracted from the corrected flow data to determine the RDII flow component.
- Figure 9. The estimated WWF or RDII time series after extaction fo the mean DWF and DWF Pattern.

Step 6. Calibrate the 12 RDII Parameters
One of the objectives of decomposing flow monitoring data into dry weather flow and wet weather flow components is to improve the accuracy of modeling the wet-weather flow component. In H2OMAP SWMM, RDII flow is modeled using the RTK method as previously described. The RTK method requires definition of up to 12 parameters. Proper choice of these parameters is crucial for accurate modeling of the RDII flow. Traditionally, RDII UH parameters are assigned using a tedious and inexact trial-and-error process in which the parameters are manually adjusted in an iterative fashion to closely match wet-weather flow data with the RDII flow generated by the simulation model using the assumed RTK parameters. Since there are a vast number of possible combinations of RTK values, evaluating all options this way may not be manageable, and even knowledgeable modelers often fail to obtain good results. RDII Analyst uses Genetic Algorithms (GA) optimization to automatically determine the UH parameters that best match the RDII time series generated by the RDII Analyst with the RDII flow estimated using H2OMAP SWMM.
The RDII calibration tool is launched using Analysis -> Calibrate RDII Parameters or using from tools. Minimum and maximum value for each parameter should be defined using the RTK Parameters Range dialog editor.
The calibration tool systematically searches for the best set of parameters that matches the RDII flow simulated by H2OMAP SWMM with RDII time series determined by the decomposition process. The parameter values would be searched within the minimum and the maximum ranges assigned by the user on dialog editor shown above. The model would adjust the nominal parameter values assigned by the user on H2OMAP SWMM RDII hydrograph dialog editor (see below) by a randomly selected multiplier within the range assigned for the parameter and chooses the optimal set of adjustments. The Tributary Area may be taken from the sewershed area defined in H2OMAP SWMM’s Hydrograph page, or the user can directly specify area of the tributary sewersheds. In addition, the user has the option to use sewershed area of the nodes defined in a domain. The Ensure that R1>R2>R3 option ensures that the RDII flow contributed by the first triangle (fast flow contribution) would be higher than contribution of the second triangle (intermediate flow), and contribution of the second triangle would be higher than that of the third triangle (slow flow).
Domain Node option is checked, sewershed area of the nodes included in the domain will be considered. Nodes in the domain will not contribute sewershed area. Once the parameters are assigned, hitting the OK button would initiate the calibration dialog box (see below).
Options: Some Genetic Algorithms (GAs) parameters may be defined using the options page initiated by clicking the Options button on the Calibrate RDII Parameters dialog box.
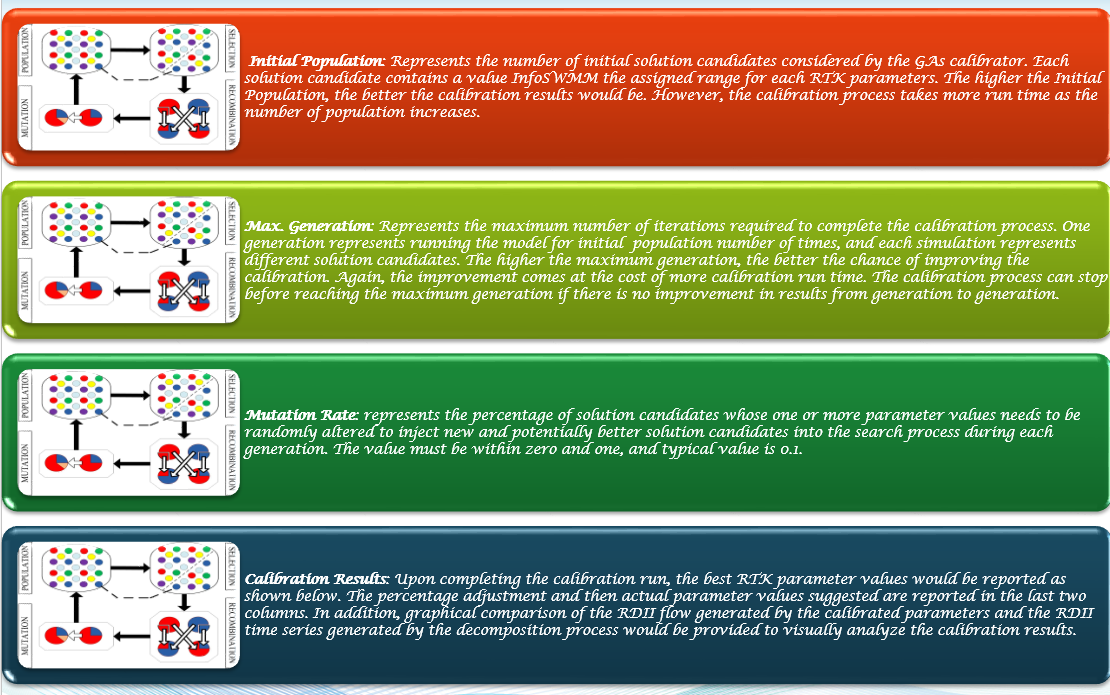
Initial Population: Represents the number of initial solution candidates considered by the GAs calibrator. Each solution candidate contains a value H2OMAP SWMM the assigned range for each RTK parameters. The higher the Initial Population, the better the calibration results would be. However, the calibration process takes more run time as the number of population increases.
Max. Generation: Represents the maximum number of iterations required to complete the calibration process. One generation represents running the model for initial population number of times, and each simulation represents different solution candidates. The higher the maximum generation, the better the chance of improving the calibration. Again, the improvement comes at the cost of more calibration run time. The calibration process can stop before reaching the maximum generation if there is no improvement in results from generation to generation.
Mutation Rate: represents the percentage of solution candidates whose one or more parameter values needs to be randomly altered to inject new and potentially better solution candidates into the search process during each generation. The value must be within zero and one, and typical value is 0.1.
Calibration Results: Upon completing the calibration run, the best RTK parameter values would be reported as shown below. The percentage adjustment and then actual parameter values suggested are reported in the last two columns. In addition, graphical comparison of the RDII flow generated by the calibrated parameters and the RDII time series generated by the decomposition process would be provided to visually analyze the calibration results
- Figure 10. The 12 RTK parameters can be estimated with min and max constraints to find the best fit parameters.

Step 7. Examine the Calibration Report
The number of trial runs made so far, the maximum number of trials to be made and the best fitness obtained from the trail runs made so far would be shown while the model is running. If there is no significant improvement in the fitness for some time (i.e., from generation to generation), then the calibration process would be stopped. Once the calibration run is completed, the RDII flow simulated by the optimal RTK parameters identified by the calibration process would be compared graphically with the RDII time series obtained from the decomposition process. In addition, the optimal RTK parameters identified by the model would also be presented in table form.
RDII Analyst can further analyze the RDII time series to identify RDII events. Breaking RDII time series into separate events can enable a better understanding of the RDII process and aid in process of calibrating the model. Event definition depends on the values assigned for the inputs given in the RDII EVENT IDENTIFICATION dialog box shown below.
Minimum Rainfall Volume: represents the minimum rainfall depth that needs to be collected from “continuous” rain to initiate an event. By continuous rain, it means that for two rainfall occurrences to be considered as one event the time interval between the successive rains should not exceed the interevent time threshold defined by the user.
Minimum RDII Flow: represents the minimum RDII flow that should be generated as the result of the rainfall collected over the duration to accept the occurrence as an event.
Minimum Length of the Event (hr): refers to the minimum length of time that the RDII flow should exceed the minimum RDII flow for the occurrence to be accepted as an event.
Interevent Time Threshold (hr): refers to the length of time needed to separate two successive events. If two rainfall occurrences are separated by duration shorter than the Interevent Time Threshold, then the two rainfall occurrences are considered as one event.
Length of Time for Rain to become RDII (hr): This input refers to average time span for a rainfall event to start contributing RDII to the collection system. Depending on this input, the RDII event identification algorithm tests if an RDII flow has occurred within the Length of Time for Rain to become RDII (hr) after a rainfall event.
Tributary Area: This input is used to compute RDII flow depth based on RDII flow volume determined for each event. RDII Analyst can use the sewershed area defined in InfoSWMM’s RTK Hydrograph page, or the user can directly specify area of the tributary sewersheds. In addition, the user has the option to use sewershed area of the nodes defined in a domain. If the Use Domain Node option is checked, sewershed area of the nodes included in the domain will be considered. Nodes in the domain will not contribute sewershed area.
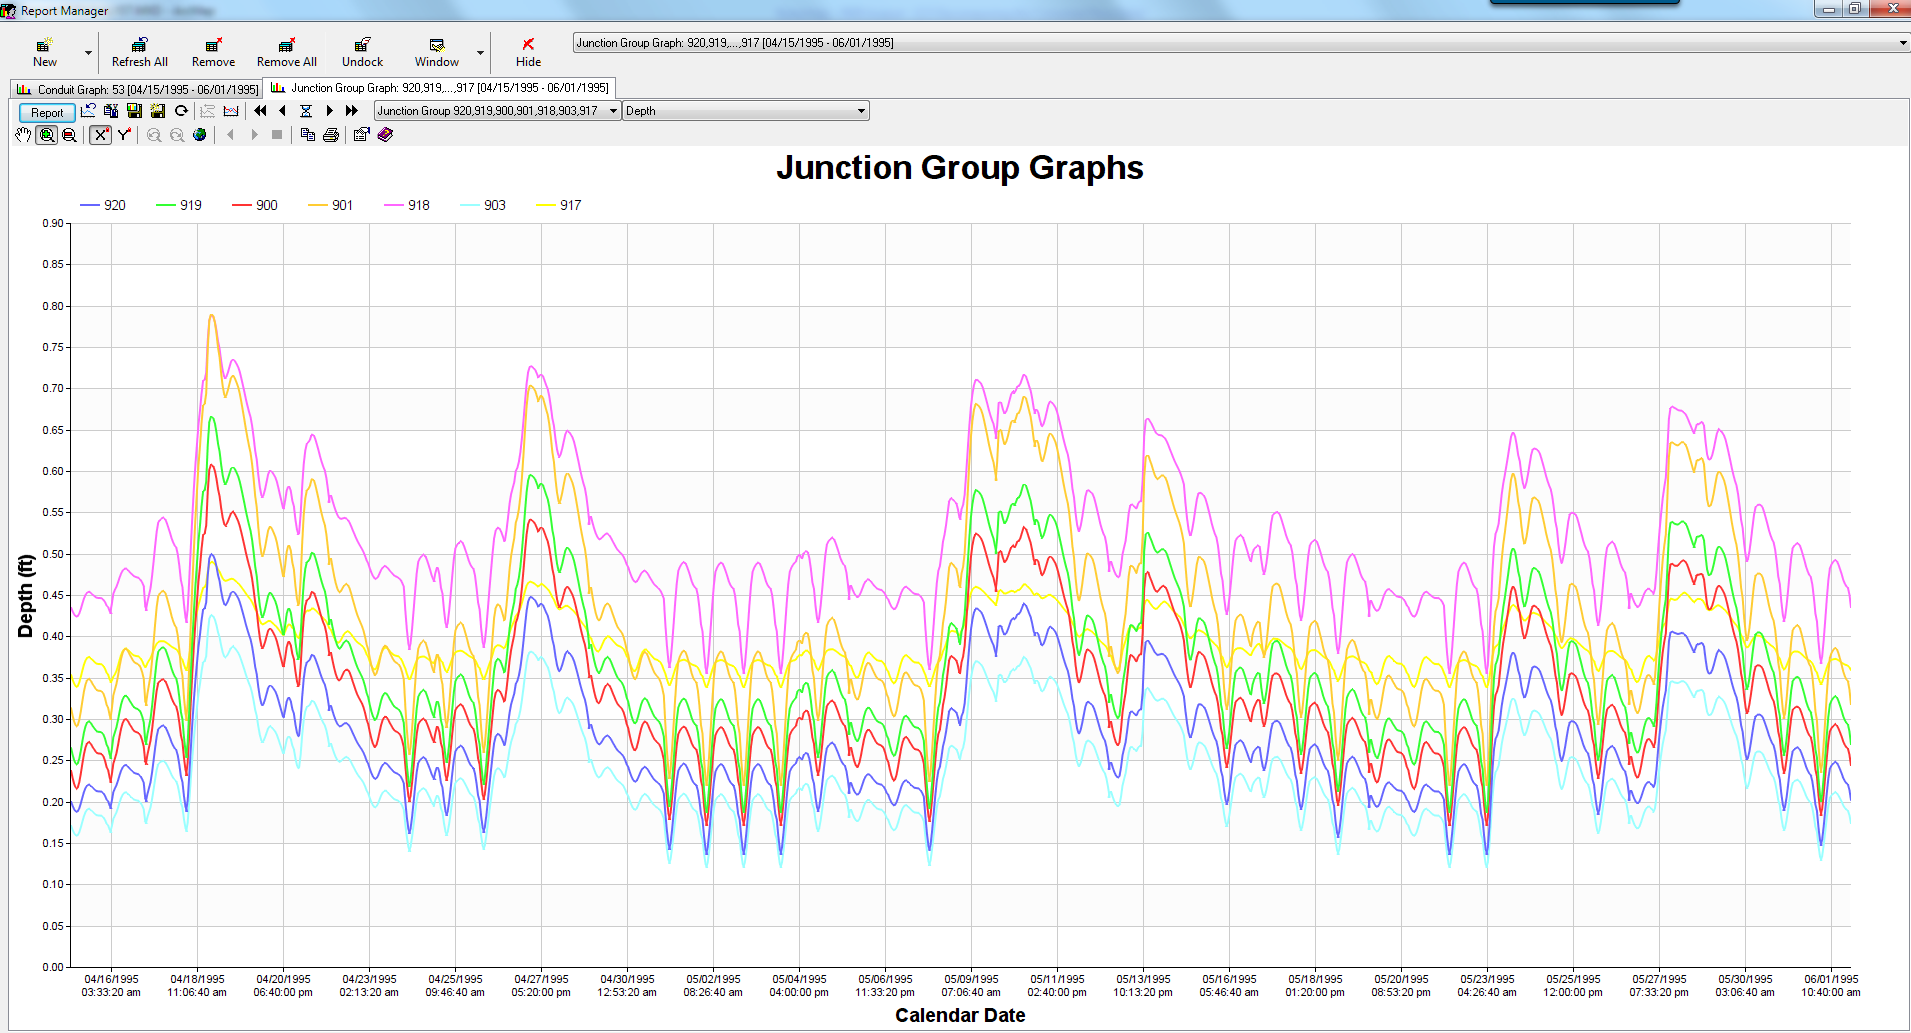
- Figure 11. A Calibration Graph of the Monitored and Predicted RDII Time Series.

Step 8. RDII Event Analysis Results
Linear Regression Results: A linear regression equation is developed between the RDII depth and rainfall depth identified for each event. Slope of the regression equation represents the fraction of rainfall depth that enters the sewer system in the form of RDII (i.e., a representative R for all events).
- Figure 12. Correlation plot of Observed versus Calibrated RDII Volume for the simulated events.
Step 9. Export the RDII RTK Parameters to InfoSWMM
This function assigns either the RTK parameters determined by the calibration tool or the RDII time series determined by decomposing the flow monitoring data to InfoSWMM nodes that contribute flow to the monitoring site. The RTK parameters could be exported to InfoSWMM and assigned to RDII hydrographs for each contributing node. The time series is assigned to the nodes as external inflow. The RDII time series is allocated to the contributing nodes either proportional to sewershed area of each contributing node, or simply equally among all contributing nodes. The user must provide a name for the Hydrograph and/or the Time Series. The assignment could be limited to nodes in a domain by checking the Assign to Domain Nodes option. Please note that if both the GWF time series and the RDII time series are exported into InfoSWMM , only the time series exported last would be available for use. InfoSWMM takes only one exported external inflow time series at a time.
- Figure 13. The 12 RTK parameters can now be exported back to InfoSWMM and H2OMAP SWMM.

- Figure 14. The 12 RTK parameters in the Operations tab of the InfoSWMM Attribute Browser.

- Figure 15. GA options in RDII Analyst
- Figure 16. How the Exported DWF looks in InfoSWMM graphs of lateral flow at nodes
Subscribe to:
Posts (Atom)