Mini Slide Show for #SWMMLive which reads I#nfoSWMM files in a @innovyze #ICM GUI pic.twitter.com/R6D7zVChQQ
— Robert E Dickinson (@RDickinson) June 25, 2014
Wednesday, June 25, 2014
#SWMMLive which reads I#nfoSWMM files in a @innovyze #ICM GUI
Sunday, June 22, 2014
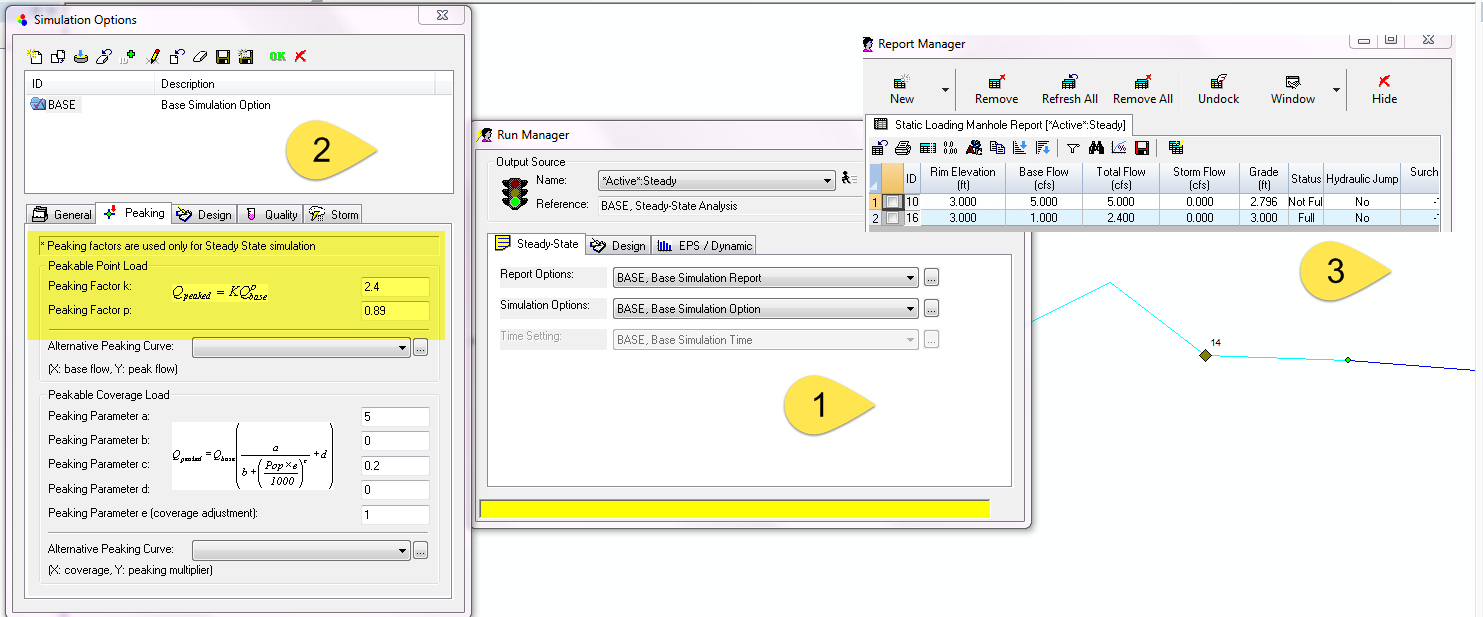
Peaking flow in InfoSewer Steady State applied as Total Flow in an EPS Simulation
One of the advantages of the three Run options in InfoSewer (Bullet 1 in the image) which are Steady Sate, Design and Extended Period or EPS Modeling is that you can use Peaking Flow Factors for the Steady State Loading Manholes (Bullet 2 in the image). Unfortunately, you cannot use Peaking Factors for EPS simulations which is often a modeling issue. However, you can copy the Total Flow for each node in the Steady State Output Report and use this Total Flow as an EPS "other" loading (Bullet 3 in the image). In an EPS Simulation you can use the Advanced Force Main Modeling option and automatically have flow splits for Force Mains and model more complicated Force Main configurations. If you just simulate the EPS for one hour then you have a quasi steady state simulation with Total Flow (Unpeakable + Peakable) and the Advanced Force Main Solution.
A list of steps you need to take to use the Peak Flow from a Steady State Run in an EPS Simulation include
1. Use Peaking Factor in InfoSewer for Steady State
2. Copy Total Loads at Manholes
3. Use the Total Loads in an EPS simulation
4. Run the EPS Simulation for a short period of time
5. If might help to have two scenarios for this copy and pasting
6. Use the Advanced FM solution for only the EPS Simulation
2. Copy Total Loads at Manholes
3. Use the Total Loads in an EPS simulation
4. Run the EPS Simulation for a short period of time
5. If might help to have two scenarios for this copy and pasting
6. Use the Advanced FM solution for only the EPS Simulation
 |
| Peaking flow in InfoSewer Steady State applied as Total Flow in an EPS Simulation |
Wednesday, June 11, 2014
How to make a smaller model out of your larger InfoSWMM or H2OMap SWMM network
How to make a smaller model out of your larger InfoSWMM or H2OMap SWMM network:
- Make a domain and then an active facility from the domain for your larger network
- Export the Active Newtork in the current scenario to SWMM 5
- Import the smaller model from SWMM 5 into a different InfoSWMM model
- You now have a smaller model in InfoSWMM or H2OMap SWMM.
 |
| Steps to Make a Smaller Model from an InfoSWMM or H2OMap SWMM Model |
Sunday, June 8, 2014
d/D, q/Q for a Link in SWMM 5, InfoSWMM and H2oMap SWMM
d/D, q/Q for a Link in SWMM 5, InfoSWMM and H2oMap SWMM
How do we look at the various measures of "fullness" in a pipe of link in SWMM 5? Here we look at some graphs from InfoSWMM.
d/D is the pipe depth over the full depth of the link
q/Q is the current link flow over Qfull for the link (Q full is the full flow of a link based on Manning's equation) This Qfull is based on the bed slope of the link. You can have a q/Q or q/Qfull greater than 1 if the water surface slope is greater than the bed slope of a link. This is especially true for flat links where SWMM 5 has a minimum slope of 0.001
The image shown below shoes that at the peak flow in the links is greater than 1 even though the pipe is not full (d/D less than 1) for this model of flat slopes. Qfull is a comparison metric and not the result of the simulation.
 |
| d/D, q/Q for a Link in SWMM 5, InfoSWMM and H2oMap SWMM |
Friday, June 6, 2014


Urban frogs adapting to Urban Stormwater Networks in Taiwan
Urban frogs adapting to Urban Stormwater Networks in Taiwan
"The frogs have learned to overcome that limitation by calling from within storm drains, since the drains enhance both volume and duration, allowing the frogs' calls to reach receivers both nearby and farther away.
"Concrete drains are miniature canyons, but are not analogous to anything in Mientien tree frog natural habitats," the researchers say. "Therefore, it is interesting to find those frogs preferentially calling in the drains." The frogs have taken the human built environment and turned it into a tool, rather than an obstacle to overcome, allowing their species to survive an environment dominated by our species."
Wednesday, June 4, 2014
Cool Inlets, Suds, LID Images from Twitter
Come across some different takes on sensitive SuDS inlets and outlets... pic.twitter.com/ly8ruIjU8G
— susdrain @ CIRIA (@Sudsulike) May 17, 2014
KC approach to storm water management. pic.twitter.com/gS1eR9f2ek
— steve sinclair (@stevesinclair52) May 21, 2014
And another one, for all those thinking of retrofitting a rain garden or two... pic.twitter.com/KO6kyPD8H7
— susdrain @ CIRIA (@Sudsulike) May 17, 2014
RT @SuDSWales: Bioretention planter in Llanelli. Part of the @DwrCymru RainScape programme (soon to be on @sudsulike) pic.twitter.com/hPR3wuzX9e
— susdrain @ CIRIA (@Sudsulike) May 15, 2014
KC approach to storm water management. pic.twitter.com/gS1eR9f2ek
— steve sinclair (@stevesinclair52) May 21, 2014
Monday, June 2, 2014
New SWMM 5.1.006 is now available from the EPA Site
New SWMM 5.1.006 is now available from the EPA Site
http://www.epa.gov/nrmrl/wswrd/wq/models/swmm/
with these engine changes

http://www.epa.gov/nrmrl/wswrd/wq/models/swmm/
with these engine changes
-------------------------
Build 5.1.006 (5/19/2014)
-------------------------

Engine Updates:

1.   The updating of the next time that detailed LID results
     should be written to file during a simulation was modified
     to avoid an off-by-one error.

2.   The number of decimal places for hourly evaporation written
     to a detailed LID report was increased.

3.   The amount of soil water available for evaporation in
     LID units with soil layers wasn't being limited by the
     water remaining below the wilting point.

4.   The equation that computes the rate of water infiltrating
     into permeable pavement LIDs had a misplaced parenthesis.

5.   There was a units conversion error in computing the
     contribution of a pollutant in direct precipitation
     to the water quality on a subcatchment.
Thursday, May 29, 2014
Overflow in InfoSewer
"Discover the unique water retention capabilities in InfoSewer 💧🛠️:
Unlike InfoSWMM, InfoWorks ICM, and InfoWorks CS, InfoSewer maintains its composure under pressure. During Extended Period Simulations (EPS), even when the Hydraulic Grade Line (HGL) kisses the Rim Elevation, no water escapes the chamber and loading manholes. 💦🚫
However, keep a watchful eye on those Wet Wells! They will release water once filled to the brim. 🌊🕳️
One critical output parameter to monitor is 'Overflow'. Here's a quick guide:
- Overflow Equation: Overflow = Flow in Link - Q full for the Link
- Understanding Overflow:
- A negative Overflow value signals an unfulfilled pipe; it's not at full capacity based on q/Qfull. 📉
- A positive Overflow indicates a full house; the pipe has reached its max. 📈
- Measuring Units: Overflow's units align with the units of Flow in InfoSewer.
Stay in control of your network's flow dynamics with InfoSewer's precision in water management 🔍💡."
 |
| What is Overflow in InfoSewer? |
Monday, May 12, 2014
SWMM 5 Groundwater and Node Elevation Relationship Options
If you want the SWMM 5 groundwater Subcatchment routing to use the the aquifer water table elevation, the node invert elevation and the depth of water in the receiving water node then you should use values of 0, blank and blank for Surface Water Height, Channel Bottom Height and Water Table Elevation, respectively (Figure 1). As shown in Figure 2, if the Groundwater starts out at the same elevation as the receiving water node the flow can be both negative and positive into the groundwater comparatments as the depth in the node and the infiltration for the Subcatchment change.
 |
| Figure 1. SWMM5 Groundwater Elevations |
 |
| Figure 2. SWMM 5 Groundwater and Node Elevation Relationship Options |
Tuesday, May 6, 2014
How to Change the Spatial Coordinates in Arc Map for InfoSWMM and InfoSewer
If you have an unknown coordinate system in InfoSewer or InfoSWMM, this is one way to fix the unknown coordinate issue.
Here
is how you fix the coordinate issue so you can view your model in Google Maps:
1 1. Use export manager and save a
shape file of your manhole or junction data,
2. Next (there are a lot of ways to do this) use Arc Map Tools and define the saved shape file as Australian GDA1994 MGA 1956
3. Now, merge your InfoSWMM Model with the newly created and newly defined Australian GDA1994 MGA 1956 shape file
4. Next, change the project spatial reference to Australian GDA1994 MGA 1956 and zoom to your layers
5. You now can have a background image layer and
6. You can see the streets next to the inlets of your model in Google Maps.
 |
| Arc Map Tools for Defining the Projection of a Shapefile |
Thursday, May 1, 2014
Release of SWMM 5.1.005
-------------------------
Build 5.1.005 (4/23/2014)
-------------------------

Engine Updates:

1.  A problem with reading hydraulic results from a hot start
    file was fixed.

GUI Updates:

1.  The appearance of the Open File Dialog with preview panel
    was improved.

2.  In the property Editor for storage nodes, the Ponded Area
    property was made read-only since storage nodes are not
    allowed to pond water.

3.  Some issues with pop-up topic windows in the Help file
    being obscured by the main Help window were fixed.
http://www.epa.gov/nrmrl/wswrd/wq/models/swmm/#Downloads

Tuesday, April 22, 2014
Release of SWMM 5.1.004
-------------------------
Build 5.1.004 (4/14/2014)
-------------------------

Engine Updates:

1.  Support for the Ignore RDII analysis option was added to
    the engine.

GUI Updates:

1.  A refactoring bug that ignored any changes to numerical
    precision made in the Program Preferences dialog was fixed.

2.  Another refactoring bug from 5.1.003 that caused projects
    with groundwater aquifers not to run was fixed.
http://www.epa.gov/nrmrl/wswrd/wq/models/swmm/#Downloads

Sunday, April 20, 2014
Seven Types of LID controls in SWMM 5.1
Seven Types of LID controls in SWMM 5.1 in one Image - the graphics are fantastic in my opinion.
 |
| Seven Types of LID controls in SWMM 5.1 |
Saturday, April 19, 2014
Top 10 #tips and tricks for @Snagit in a short, illustrated PDF guide
I love Snagit and Jing, which are very good screen capturing and editing programs. The 2nd Tweet allows you to download a PDF file of Tips from Snagit
Tweeted from @Snagit http://t.co/pVRPqkv6lT http://t.co/QlP9BH02l5 Tips for Snagit
— Robert E Dickinson (@RDickinson) April 19, 2014
Top 10 #tips and tricks for Snagit in a short, illustrated PDF guide that you can download here: http://t.co/OcI943LJsM #smb
— TechSmith Snagit (@Snagit) April 18, 2014
Thursday, April 17, 2014
A note about Lew Rossman the creator of EPANet
A note about Lew Rossman the creator of EPANet http://t.co/50xiwbj8iw http://t.co/2ZJM7rMKTV
— Robert E Dickinson (@RDickinson) April 17, 2014
Tuesday, April 15, 2014
Release of SWMM 5.1.003
------------------------
Build 5.1.003 (4/8/2014)
------------------------
Engine Updates:

1.  A new property, the Upper Zone Evap. Pattern, was added to
    the Aquifer object. It allows one to adjust the aquifer's
    upper zone evaporation fraction by month of the year.

2.  A bug in writing/reading RDII flows to the new binary RDII
    file was fixed.

GUI Updates:

1.  A refactoring bug that prevented SWMM from working
    correctly for users with non-US Windows regional settings
    was fixed.

2.  A refactoring bug the prevented the Group Delete feature from
    working was fixed.

3.  Issues with stay-on-top forms obscuring modal dialog forms,
    with the Browser panel disappearing if its width was made too
    small and with not being able to browse the Help system when a
    modal form had focus were fixed (these unforseen issues were
    caused by the switch to Delphi XE2 from Delphi 7).

4.  The Aquifer Editor form was updated to accept the new upper
    evaporation pattern property.
http://www.epa.gov/nrmrl/wswrd/wq/models/swmm/

Friday, April 4, 2014
Twenty Four Conduit Shapes in InfoSWMM/H2OMap SWMM and SWMM 5
Twenty Four Conduit Shapes in InfoSWMM/H2OMap SWMM and SWMM 5
 |
| H2OMap SWMM Conduit Shape Dialog |
Thursday, March 27, 2014
SWMM 5.1 Update History Or Key Changes
SWMM 5.1 Update History
http://www.epa.gov/nrmrl/wswrd/wq/models/swmm/#Downloads
Build 5.1.001
-----------------------
Engine Updates
New Features:
=============
1. SWMM can now read the new file format for precipitation
data retrieved online from NOAA-NCDC.
2. A new choice of infiltration method, the Modified Horton
method, has been added. This method uses the cumulative
infiltration in excess of the minimum rate as its state
variable (instead of time along the Horton curve),
providing a more accurate infiltration estimate when
low rainfall intensities occur.
3. RDII interface files created internally by SWMM are now
saved in a binary format to reduce storage space. The ASCII
text format for these files is still supported for users
that find it desireable to create the files outside of SWMM.
4. Two new categories of LID controls, one for Green Roofs and
another for Rain Gardens, have been added so they no longer
have to be configured from the Bio-Retention Cell control
(although that option still remains). The Green Roof uses
a new Drainage Mat layer to store and convey the water that
percolates through the soil layer.
5. Users can now add their own groundwater outflow equation to
a subcatchment, to be used in place of or in addition to the
standard equation. Similar to treatment functions, the equation
can be any mathematical expression that uses the same ground-
water variables that appear in the standard equation.
6. Evaporation of water from open channels has been added.
7. A new conduit property named Seepage Rate (in/hr or mm/hr)
has been added to model uniform seepage along the bottom
and sloped sides of a conduit.
8. Infiltration from storage units is now referred to as
seepage, to be consistent with seepage from conduits. The
only required parameter is a seepage rate (in/hr or mm/hr).
Previous data files that supply a set of Green-Ampt
infiltration parameters will still be recognized.
9. Separate accounting and reporting of evaporation and
seepage losses in storage units is now made.
10. Open rectangular channels now have a new parameter that
specifies if one or both side wall surfaces should be
ignored when computing a hydraulic radius (to provide
improved support for quasi-2D modeling of wide channels
and overland flooding).
11. New Dynamic Wave Analysis options have been added for
the maximum number of iterations and head tolerance used
at each time step. The percentage of time steps where
convergence is not achieved is also now reported.
12. Users can now set the flow tolerances that determine if
flow routing calculations can be skipped because steady
state conditions hold.
13. Control rules can now use a conduit's OPEN/CLOSED status
in both premise conditions and action clauses.
14. The meaning of the link view variable "Capacity" has been
changed. For conduits it is now the fraction of the full
cross section area filled by the flow, while it is the
control setting for all other types of links (the meaning
of the control setting varies by link type -- see the Help
file or the Users Manual).
15. The link Froude number view variable has been replaced with
the link's flow volume, the subcatchment Losses variable has
been replaced by two new variables - Evaporation and
Infiltration, and upper groundwater zone Soil Moisture has
been added as a new view variable.
16. The Node Inflows Summary table of the Status Report now
includes a new column that lists the mass balance error
in volume units for each node.
17. A new summary table, Link Pollutant Load, has been added
that displays the total mass load of each pollutant that
flows through each link.
Improvements:
=============
18. Using a Drain Delay time of 0 for Rain Barrel LIDs now means
that the barrel is allowed to drain continuously, even as it
is filling during wet weather periods.
19. The requirement that an impervious surface must be dry
(have no more than 0.05 inches of standing water) before
it could be subjected to street sweeping has been dropped.
20. After runoff ceases and a land surface goes dry due to
evaporation, any remaining mass of pollutant originating
from direct deposition or upstream runon is assumed to be
unavailabe for future washoff (it shows up as Remaining
Buildup in the mass balance report).
21. The way that wet weather washoff inflow loads are
interpolated across a flow routing time step was modified
to produce a better match between the reported total runoff
load and total quality routing inflow load.
22. The method used to select a time step for processing RDII
unit hydrographs was modified to consider the case where
K (the ratio of rising limb to falling limb duration) is
below 1.0.
23. When the moisture content of the upper groundwater zone
reaches saturation, the depth of the lower saturated zone
is now set equal to the full aquifer depth (minus a small
tolerance).
24. Conduits with negative slopes whose absolute value is
below the Minimum Slope option will have their slope
changed to the positive minimum value, thus allowing
them to be analyzed using the Steady Flow and Kinematic
Wave routing options.
25. The Avg. Froude Number and Avg. Flow Change columns in the
Flow Classification Summary table have been replaced with the
fraction of time steps that flow is limited to normal flow
and the fraction of time steps that flow is inlet controlled
(for culverts).
26. An error condition now occurs if a pump's startup depth
is less than its shutoff depth.
27. Only the upstream node for orifice and weir links is now
checked to see if its maximum depth needs to be increased
to meet the top elevation of the orifice or weir opening.
28. Weirs are no longer allowed to operate as an orifice when
they surcharge. Instead any excess flow will flood the
upstream node.
29. A warning message is now written to the Status Report if
the crest elevation of a regulator link is below its
downstream node's invert.
30. When a reporting time falls in between a computational time
step during which a pump's on/off status changes, the reported
pump flow is the value at either the start or end of the time
step depending on which is closer to the reporting time (i.e.,
no interpolation is used).
31. Control rule conditions can now accept elapsed time or
time of day values as decimal hours in addition to hours:
minutes:seconds.
32. The test for a control rule condition equaling a specified
elapsed time or time of day was modified to more accurately
capture its occurrence.
33. If the Water Quality analysis option is disabled then the
binary results file no longer contains any pollutant values
(of 0) for all time periods.
34. Hot Start files now contain the complete state of the watershed
and conveyance system, so that future simulations can start up
correctly where they left off.
35. The following changes to error reporting were made:
- Error 319 was re-numbered to 320 and a new Error 319
was added for a rainfall data file with unknown format.
- Format errors in external time series files are now
listed as Error 363 (invalid data) instead of Error
173 (time series out of sequence).
36. Warning messages written to the Status Report are now
single spaced instead of double spaced. See report.c.
37. The Link Summary table in the Status Report now lists conduits
with negative slopes in their original orientation instead of
in their reversed state.
Bug Fixes:
==========
38. A refactoring bug from 5.0.022 that prevented snowmelt
from infiltrating has been fixed.
39. Snowmelt rate during rainfall conditions and the updating
of the antecedent temperature index were were not being
converted from the six hour time interval used in Anderson's
original NWS snowmelt model to the hourly basis used in SWMM.
40. A refactoring bug that failed to set the maximum number of
characters high enough for a line read from a user-prepared
rainfall data file has been fixed.
41. The optional Maximum Volume parameter for Horton
infiltration was not allowing any recovery of infiltration
capacity between storm events.
42. Evaporation from the lower groundwater zone was being
computed from the rate remaining after surface and upper
zone evaporation was considered instead of from the
unadjusted rate (with a reduction afterwards if it exceeds
the remaining available rate).
43. An error in applying the Vegetation Volume Fraction parameter
to swales was corrected.
44. The time from the last rainfall used to determine when a
Rain Barrel should begin to empty wasn't being computed
correctly.
45. An erroneous error message for Rain Barrel LIDs with a
zero Void Ratio has been fixed (the Void Ratio parameter
should be ignored for Rain Barrels).
46. The display of extraneous infiltration results in detailed
reports for Rain Barrel LIDs has been eliminated.
47. The check on no street sweeping for a subcatchment during
wet periods was checking rainfall over the entire study
area instead of just the subcatchment.
48. An erroneous warning message regarding negative offsets for
pumps when elevation offsets are used has been eliminated.
49. A possible divide by zero error for trapezoidal channels
with zero bottom width has been eliminated.
50. A program crash that occurred when the Ignore Routing
option was selected and results were to be saved to a
Routing Interface file has been fixed.
51. Projects that had no subcatchments or had the Ignore
Runoff switch selected were not able to evaporate water
from storage units.
52. Weekday and weekend hourly time patterns for Dry Weather
inflows are now correctly applied in a mutually exclusive
manner.
53. The Node Flooding Summary table in the Status Report now
correctly lists the peak depth of ponded water above the
node's maximum depth (i.e., its rim or ground elevation)
instead of above its invert elevation.
54. Occasional problems caused by the date/time functions not
returning an hour between 0 and 23 (for hourly time patterns)
and being off by 1 second (when writing results to outflow
interface files) have been fixed.
55. A bug introduced in release 5.0.017 that caused the
concentration after first-order decay in a storage node to
be ignored has been fixed.
56. A bug in the Total Elapsed Time listed at the end of the
Status Report for runs taking longer than 24 hours of
computer time was fixed.
57. A correction was made for the slope correction factor used
for mitered culvert inlets.
58. The procedure for finding the surface area of a storage unit
given its volume was corrected for the case where the
storage curve has a section of decreasing area with depth.
59. The procedure for finding a cross-section area given a
section factor value was corrected for the case where the
section factor table does not have its highest value as
the last entry in the table.
60. An error in computing the hydraulic radius of the Rectangular-
Triangular conduit shape as a function of flow depth was
corrected.
GUI Updates
1. The entire GUI code was ported from Delphi 7 into Delphi XE2.
2. Different color themes for the user interface can be
selected from the Program Preferences dialog.
3. The "Data" Browser panel is now named as the "Project"
Browser.
4. The Object Toolbar has been eliminated. Visual objects
are now added to the map in the same manner as non-visual
objects -- by selecting their category from the Project
Browser and then clicking the Browser's "+" button (or
by selecting Project | Add... on the main menu).
5. The LID Control and LID Usage editors were re-designed to
accomodate the new LID control options.
6. Modifications were made to accept the new engine features
mentioned above (modified Horton infiltration, seepage rate
parameter for conduits, side wall option for rectangular
channels, and the additional Dynamic Wave routing options).
7. Modifications were made to accept the updated set of output
view variables.
8. The summary results tables that used to appear as part of the
Status Report have been moved into a separate Summary Report
that makes it easier to view and sort them.
9. The Time Series Plot selection dialog was modified to allow
more than one kind of object/variable pair to be plotted.
10. The Graph Options dialog was modified to allow a vertical
axis to be inverted (as when plotting an inverted rainfall
hyetograph on the same graph as a runoff hydrograph).
11. The option to compute evaporation using the Hargreaves
equation wasn't being saved along with the rest of a project.
12. If pollutants are defined for a project but the Water Quality
analysis option is not selected, then after a new analysis is
made pollutants will no longer be listed as theme variables in
the Map Browser nor will they be available for graphs, tables
or statistical reports.
13. The columns for the [XSECTIONS] section of a saved project
file now includes a heading label for "Culvert Code".
http://www.epa.gov/nrmrl/wswrd/wq/models/swmm/#Downloads
Build 5.1.002
-----------------------
Engine Updates:

1.  A bug that prevented hotstart files with the latest format
    from being read was fixed.

2.  Only non-ponded surface area is saved for use in the dynamic
    wave surcharge algorithm (when water depth is close to the
    node's crown elevation).

GUI Updates:

1.  Creation of auxilary forms on startup was moved from the
    main form's OnActivate event to its OnCreate event, while
    creation of the map form was moved tothe OnShow event.

2.  The routines for saving and reading the main form's position
    and size in the swmm5 .ini file were modified.

3.  A memory leak related to copying cells from the grid editor
    used in various dialogs was fixed.
-----------------------Build 5.1.001
-----------------------
Engine Updates
New Features:
=============
1. SWMM can now read the new file format for precipitation
data retrieved online from NOAA-NCDC.
2. A new choice of infiltration method, the Modified Horton
method, has been added. This method uses the cumulative
infiltration in excess of the minimum rate as its state
variable (instead of time along the Horton curve),
providing a more accurate infiltration estimate when
low rainfall intensities occur.
3. RDII interface files created internally by SWMM are now
saved in a binary format to reduce storage space. The ASCII
text format for these files is still supported for users
that find it desireable to create the files outside of SWMM.
4. Two new categories of LID controls, one for Green Roofs and
another for Rain Gardens, have been added so they no longer
have to be configured from the Bio-Retention Cell control
(although that option still remains). The Green Roof uses
a new Drainage Mat layer to store and convey the water that
percolates through the soil layer.
5. Users can now add their own groundwater outflow equation to
a subcatchment, to be used in place of or in addition to the
standard equation. Similar to treatment functions, the equation
can be any mathematical expression that uses the same ground-
water variables that appear in the standard equation.
6. Evaporation of water from open channels has been added.
7. A new conduit property named Seepage Rate (in/hr or mm/hr)
has been added to model uniform seepage along the bottom
and sloped sides of a conduit.
8. Infiltration from storage units is now referred to as
seepage, to be consistent with seepage from conduits. The
only required parameter is a seepage rate (in/hr or mm/hr).
Previous data files that supply a set of Green-Ampt
infiltration parameters will still be recognized.
9. Separate accounting and reporting of evaporation and
seepage losses in storage units is now made.
10. Open rectangular channels now have a new parameter that
specifies if one or both side wall surfaces should be
ignored when computing a hydraulic radius (to provide
improved support for quasi-2D modeling of wide channels
and overland flooding).
11. New Dynamic Wave Analysis options have been added for
the maximum number of iterations and head tolerance used
at each time step. The percentage of time steps where
convergence is not achieved is also now reported.
12. Users can now set the flow tolerances that determine if
flow routing calculations can be skipped because steady
state conditions hold.
13. Control rules can now use a conduit's OPEN/CLOSED status
in both premise conditions and action clauses.
14. The meaning of the link view variable "Capacity" has been
changed. For conduits it is now the fraction of the full
cross section area filled by the flow, while it is the
control setting for all other types of links (the meaning
of the control setting varies by link type -- see the Help
file or the Users Manual).
15. The link Froude number view variable has been replaced with
the link's flow volume, the subcatchment Losses variable has
been replaced by two new variables - Evaporation and
Infiltration, and upper groundwater zone Soil Moisture has
been added as a new view variable.
16. The Node Inflows Summary table of the Status Report now
includes a new column that lists the mass balance error
in volume units for each node.
17. A new summary table, Link Pollutant Load, has been added
that displays the total mass load of each pollutant that
flows through each link.
Improvements:
=============
18. Using a Drain Delay time of 0 for Rain Barrel LIDs now means
that the barrel is allowed to drain continuously, even as it
is filling during wet weather periods.
19. The requirement that an impervious surface must be dry
(have no more than 0.05 inches of standing water) before
it could be subjected to street sweeping has been dropped.
20. After runoff ceases and a land surface goes dry due to
evaporation, any remaining mass of pollutant originating
from direct deposition or upstream runon is assumed to be
unavailabe for future washoff (it shows up as Remaining
Buildup in the mass balance report).
21. The way that wet weather washoff inflow loads are
interpolated across a flow routing time step was modified
to produce a better match between the reported total runoff
load and total quality routing inflow load.
22. The method used to select a time step for processing RDII
unit hydrographs was modified to consider the case where
K (the ratio of rising limb to falling limb duration) is
below 1.0.
23. When the moisture content of the upper groundwater zone
reaches saturation, the depth of the lower saturated zone
is now set equal to the full aquifer depth (minus a small
tolerance).
24. Conduits with negative slopes whose absolute value is
below the Minimum Slope option will have their slope
changed to the positive minimum value, thus allowing
them to be analyzed using the Steady Flow and Kinematic
Wave routing options.
25. The Avg. Froude Number and Avg. Flow Change columns in the
Flow Classification Summary table have been replaced with the
fraction of time steps that flow is limited to normal flow
and the fraction of time steps that flow is inlet controlled
(for culverts).
26. An error condition now occurs if a pump's startup depth
is less than its shutoff depth.
27. Only the upstream node for orifice and weir links is now
checked to see if its maximum depth needs to be increased
to meet the top elevation of the orifice or weir opening.
28. Weirs are no longer allowed to operate as an orifice when
they surcharge. Instead any excess flow will flood the
upstream node.
29. A warning message is now written to the Status Report if
the crest elevation of a regulator link is below its
downstream node's invert.
30. When a reporting time falls in between a computational time
step during which a pump's on/off status changes, the reported
pump flow is the value at either the start or end of the time
step depending on which is closer to the reporting time (i.e.,
no interpolation is used).
31. Control rule conditions can now accept elapsed time or
time of day values as decimal hours in addition to hours:
minutes:seconds.
32. The test for a control rule condition equaling a specified
elapsed time or time of day was modified to more accurately
capture its occurrence.
33. If the Water Quality analysis option is disabled then the
binary results file no longer contains any pollutant values
(of 0) for all time periods.
34. Hot Start files now contain the complete state of the watershed
and conveyance system, so that future simulations can start up
correctly where they left off.
35. The following changes to error reporting were made:
- Error 319 was re-numbered to 320 and a new Error 319
was added for a rainfall data file with unknown format.
- Format errors in external time series files are now
listed as Error 363 (invalid data) instead of Error
173 (time series out of sequence).
36. Warning messages written to the Status Report are now
single spaced instead of double spaced. See report.c.
37. The Link Summary table in the Status Report now lists conduits
with negative slopes in their original orientation instead of
in their reversed state.
Bug Fixes:
==========
38. A refactoring bug from 5.0.022 that prevented snowmelt
from infiltrating has been fixed.
39. Snowmelt rate during rainfall conditions and the updating
of the antecedent temperature index were were not being
converted from the six hour time interval used in Anderson's
original NWS snowmelt model to the hourly basis used in SWMM.
40. A refactoring bug that failed to set the maximum number of
characters high enough for a line read from a user-prepared
rainfall data file has been fixed.
41. The optional Maximum Volume parameter for Horton
infiltration was not allowing any recovery of infiltration
capacity between storm events.
42. Evaporation from the lower groundwater zone was being
computed from the rate remaining after surface and upper
zone evaporation was considered instead of from the
unadjusted rate (with a reduction afterwards if it exceeds
the remaining available rate).
43. An error in applying the Vegetation Volume Fraction parameter
to swales was corrected.
44. The time from the last rainfall used to determine when a
Rain Barrel should begin to empty wasn't being computed
correctly.
45. An erroneous error message for Rain Barrel LIDs with a
zero Void Ratio has been fixed (the Void Ratio parameter
should be ignored for Rain Barrels).
46. The display of extraneous infiltration results in detailed
reports for Rain Barrel LIDs has been eliminated.
47. The check on no street sweeping for a subcatchment during
wet periods was checking rainfall over the entire study
area instead of just the subcatchment.
48. An erroneous warning message regarding negative offsets for
pumps when elevation offsets are used has been eliminated.
49. A possible divide by zero error for trapezoidal channels
with zero bottom width has been eliminated.
50. A program crash that occurred when the Ignore Routing
option was selected and results were to be saved to a
Routing Interface file has been fixed.
51. Projects that had no subcatchments or had the Ignore
Runoff switch selected were not able to evaporate water
from storage units.
52. Weekday and weekend hourly time patterns for Dry Weather
inflows are now correctly applied in a mutually exclusive
manner.
53. The Node Flooding Summary table in the Status Report now
correctly lists the peak depth of ponded water above the
node's maximum depth (i.e., its rim or ground elevation)
instead of above its invert elevation.
54. Occasional problems caused by the date/time functions not
returning an hour between 0 and 23 (for hourly time patterns)
and being off by 1 second (when writing results to outflow
interface files) have been fixed.
55. A bug introduced in release 5.0.017 that caused the
concentration after first-order decay in a storage node to
be ignored has been fixed.
56. A bug in the Total Elapsed Time listed at the end of the
Status Report for runs taking longer than 24 hours of
computer time was fixed.
57. A correction was made for the slope correction factor used
for mitered culvert inlets.
58. The procedure for finding the surface area of a storage unit
given its volume was corrected for the case where the
storage curve has a section of decreasing area with depth.
59. The procedure for finding a cross-section area given a
section factor value was corrected for the case where the
section factor table does not have its highest value as
the last entry in the table.
60. An error in computing the hydraulic radius of the Rectangular-
Triangular conduit shape as a function of flow depth was
corrected.
GUI Updates
1. The entire GUI code was ported from Delphi 7 into Delphi XE2.
2. Different color themes for the user interface can be
selected from the Program Preferences dialog.
3. The "Data" Browser panel is now named as the "Project"
Browser.
4. The Object Toolbar has been eliminated. Visual objects
are now added to the map in the same manner as non-visual
objects -- by selecting their category from the Project
Browser and then clicking the Browser's "+" button (or
by selecting Project | Add... on the main menu).
5. The LID Control and LID Usage editors were re-designed to
accomodate the new LID control options.
6. Modifications were made to accept the new engine features
mentioned above (modified Horton infiltration, seepage rate
parameter for conduits, side wall option for rectangular
channels, and the additional Dynamic Wave routing options).
7. Modifications were made to accept the updated set of output
view variables.
8. The summary results tables that used to appear as part of the
Status Report have been moved into a separate Summary Report
that makes it easier to view and sort them.
9. The Time Series Plot selection dialog was modified to allow
more than one kind of object/variable pair to be plotted.
10. The Graph Options dialog was modified to allow a vertical
axis to be inverted (as when plotting an inverted rainfall
hyetograph on the same graph as a runoff hydrograph).
11. The option to compute evaporation using the Hargreaves
equation wasn't being saved along with the rest of a project.
12. If pollutants are defined for a project but the Water Quality
analysis option is not selected, then after a new analysis is
made pollutants will no longer be listed as theme variables in
the Map Browser nor will they be available for graphs, tables
or statistical reports.
13. The columns for the [XSECTIONS] section of a saved project
file now includes a heading label for "Culvert Code".
Subscribe to:
Posts (Atom)