Autodesk Technologist with Information about Stormwater Management Model (SWMM) for watershed water quality, hydrology and hydraulics modelers (Note this blog is not associated with the EPA). You will find Blog Posts on the Subjects of SWMM5, ICM SWMM, ICM InfoWorks, InfoSWMM and InfoSewer.
Saturday, November 22, 2008
Friday, October 10, 2008
SCS Rainfall Distributions and Design Storms
SCS Rainfall Distributions for H20MAP and InfoSWMM
The base file has a 24 hyetograph for SCS Type 1A and SCS Type 2 distrubutions. The total of the rainfall is 1 inch and to make a 25 year or 50 year storm you follow these steps:
1. Clone the rainfall time series and
2. Use the Field Calculator in DB Edit to change the total rainfall by using the operand in the Field Calculator dialog. For example, the picture shown below will make a 10 inch 24 hour rainfall in the new time series.
You will end up with two series: (1) the base 1 inch hyetograph and (2) the new design storm of 10 inches.
Saturday, September 20, 2008
H2OMAP and InfoSWMM Sediment Transport Modeling
H2OMAP SWMM and InfoSWMM Sediment Transport Modeling
Sanitary and combined sewer systems can carry substantial loads of suspended solids (waste solids) which can accumulate and cause blockages thereby impairing the hydraulic capacity of the sewer pipes (by restricting their flow area and increasing the bed friction resistance). H2OMAP SWMM and InfoSWMM can simulate the transport and gravitational settling of (total suspended solids including grit) over time throughout the sewer collection system under varying hydraulic conditions. As long as flow velocity exceeds the critical/terminal velocity, H2OMAP SWMM and InfoSWMM assumes that the sewage flow has the capacity to transport all incoming . Deposited particles are also assumed to be scoured and transported downstream when velocity of the sewage flow exceeds the terminal velocity. Settling starts when flow velocity falls below the critical velocity. In the model, transport of thet particles is governed by advection implying that the particles are transported at local flow velocity.
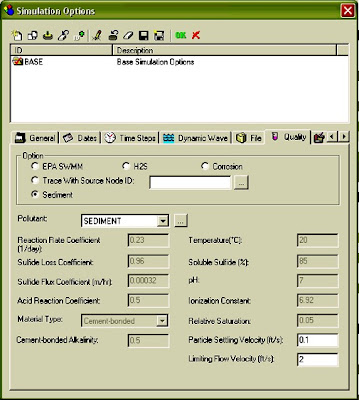
The sediment transport modeling using H2OMAP SWMM and InfoSWMM requires only few inputs, namely limiting flow velocity, particle settling velocity, and source node(s) and initial concentrations (in mg/l) at the source nodes.
In order to specify the first two inputs (i.e., limiting flow velocity and particle settling velocity), the user should first select from the quality tab which in turn activates the editing tabs for particle settling velocity and limiting flow velocity. Specification of source node(s) and its/their initial concentration is similar to the method described above in relation to pollutant transport. The default values used by the model for limiting flow velocity and particle settling velocity are 2 ft/s and 0.1 ft/s, respectively. User specified values over rid these default figures .
H2OMAP SWMM and InfoSWMM deposition (in kg) in pipes and concentration (in mg/l) at manholes, wet wells, and outlets are the outputs reported following successful simulation of transport for a collection system.
Modified Basket Handle Cross Section Warnings
There is a rule in SWMM 5 that the depth cannot be less than half the bottom width for a modified basket handle(see below). You always have to have a maximum depth less than 50 percent or 1/1 of the bottom width, If you do not meet this criterion then the program will generate an invalid number warning. This is the code from xsect.c that checks the validity of the cross section data:
case MOD_BASKET:
if ( p[1] <= 0.0 || p[0] <>
xsect->yFull = p[0]/ucf;
xsect->wMax = p[1]/ucf;
Saturday, September 13, 2008
Wave Of Sewage Flows Toward Tampa Bay
Wave Of Sewage Flows Toward Bay
Tribune photo by CANDACE C. MUNDY
Workers with Spectrum Underground Inc. work to repair a 20-inch sewage pipeline which broke in Town 'N Country this afternoon.
The Tampa Tribune
Published: September 13, 2008
TOWN 'N COUNTRY - Approximately 200,000 gallons of untreated sewage spilled into Sweetwater Creek on Friday afternoon, prompting a warning to residents along the creek to avoid the water, Hillsborough County officials said.
The spill occurred along Comanche Avenue just east of Hanley Road when a 20-inch sewage pipeline ruptured. The break was at a connection point to a section that had been replaced about eight weeks ago, officials said.
Because the work had been done so recently, it was under warranty, and the original contractor returned to fix the break, said Bill Bozeman, project manager for the county's water resource services. Bozeman did not know what caused it.
The fracture, reported by a passer-by at about 12:45 p.m., caused sewage to spill onto Hanley Road and ooze down Comanche toward the creek. The flow was contained two hours later. After five hours, a cloud of sewage still fogged the water along one of the creek's banks.
The section of Comanche where the spill occurred is home to a couple of businesses and a small strip of offices under construction. A narrow bridge over Sweetwater Creek leads to a neighborhood and to Sweetwater Organic Community Farm.
The farm does not rely on the creek for irrigation and the creek in that section is too shallow and choked with overgrowth in places for kayaking or swimming. County workers posted signs in English and Spanish notifying visitors of high bacterial levels and a health risk, telling them not to swim, wade or fish in the water.
Residents along the creek, which flows south to the Courtney Campbell Parkway area, are urged not to have any contact with the water for the next several days in the creek or the area where it flows into Tampa Bay.
While the contractor worked to repair the pipe, the county diverted the flow from nearby lift stations that serve the areas into tanker trucks.
The spill did not affect home use of water, Bozeman said.
The Water Resource Services staff will notify local and state environmental agencies, take samples and monitor the area where the spill occurred.
Sunday, September 7, 2008
SWMM 5 View Variables
There are four types of graphical variables in SWMM 5: (1) Subcatchements, (2) System, (3) Nodes and (4) Links. The SWMM 5 Hydrology binary graphics file consists of 21 view variables for each subcatcment simulation in SWMM 5. The variables are:
Subcatchment Variables | Description |
SUBCATCH_RAINFALL | rainfall intensity |
SUBCATCH_SNOWFALL | snowfall intensity |
SUBCATCH_RUNOFF | total runoff flow rate |
SUBCATCH_RUNOFF_IMPZero | runoff flow rate from zero imp area feb 2007 |
SUBCATCH_RUNOFF_IMP | runoff flow rate from imp area feb 2007 |
SUBCATCH_RUNOFF_Pervious | runoff flow rate from pervious area feb 2007 |
SUBCATCH_LOSSES | total losses (infil) |
SUBCATCH_EVAP | watershed evaporation loss |
SUBCATCH_DEPTH | watershed depth |
SUBCATCH_GW_FLOW | groundwater flow rate to node |
SUBCATCH_GW_FLOW_A1 | groundwater flow rate to node |
SUBCATCH_GW_FLOW_A2 | groundwater flow rate to node |
SUBCATCH_GW_FLOW_A3 | groundwater flow rate to node |
SUBCATCH_GW_ELEV | elevation of saturated gw table |
SUBCATCH_GW_THETA | soil moisture |
SUBCATCH_GW_PERCOLATION | aquifer deep percolation |
SUBCATCH_SNOWMELT | watershed snow melt |
SUBCATCH_SNOWDEPTH | watershed snow depth |
SUBCATCH_FREEWATER | watershed snow depth |
SUBCATCH_COLD | watershed cold content |
SUBCATCH_SNOWAREA | watershed snow coverage |
SUBCATCH_UL | soil thickness |
SUBCATCH_FTOT | infiltration during an event |
SUBCATCH_FU | current value of F |
SUBCATCH_FUMAX | maximum value of F |
SUBCATCH_MOISTURE | current soil mositure (less than porosity) |
SUBCATCH_IMD | current IMD (Porisity - Moisture) |
SUBCATCH_IMDbyEvent | IMD at the beginning of an event |
SUBCATCH_SAT | Flag for saturation (1 is saturated) |
SUBCATCH_INFIL_TIME | GA infiltration time |
SUBCATCH_WLMAX | current infiltration RATE |
SUBCATCH_NETPRECIP | rainfall intensity |
SUBCATCH_BUILDUP | pollutant buildup concentration |
SUBCATCH_WASHOFF | pollutant washoff concentration |
System Variables | Description |
SYS_TEMPERATURE | air temperature |
SYS_WINDSPEED | wind speed |
SYS_RAINFALL | rainfall intensity |
SYS_SNOWFALL | snow depth |
SYS_RUNOFF | runoff flow |
SYS_LOSSES | evap + infil |
SYS_EVAP | evap |
SYS_DWFLOW | dry weather inflow |
SYS_GWFLOW | ground water inflow |
SYS_IIFLOW | RDII inflow |
SYS_EXFLOW | external inflow |
SYS_INFLOW | total lateral inflow |
SYS_FLOODING | flooding outflow |
SYS_OUTFLOW | outfall outflow |
SYS_STORAGE | storage volume |
SYS_CE | continuity error for the basin |
SYS_ITERATIONS | average iterations over the basin |
SYS_SNOWDEPTH | snow depth |
SYS_COLD | cold storage for the basin |
SYS_SNOWMELT | snowmelt for the basin |
SYS_RAINMELT | rainmelt for the basin |
SYS_TS | time steps during the simulation |
SYS_DWFLoad | total K3 line DWF load |
SYS_WWFLoad | total K3 line WWF load |
SYS_WWFLoadExtra | agency extra WWF Load |
The SWMM 5 Node graphics binary file consists of 20 variables on one line for each junction/storage/outfall/divider simulated in SWMM 5. The variables are:
Node Variables | Description |
NODE_DEPTH | water depth above invert |
NODE_HEAD | hydraulic head |
NODE_VOLUME | volume stored & ponded |
NODE_LATFLOW | lateral inflow rate |
NODE_IIFLOW | total rdii inflow rate |
NODE_UH1 | total rdii inflow rate from UH 1 |
NODE_UH2 | total rdii inflow rate from UH 2 |
NODE_UH3 | total rdii inflow rate from UH 3 |
NODE_DWFFLOW | total DWF inflow rate |
NODE_INFLOW | total inflow rate |
NODE_OUTFLOW | total outflow rate |
NODE_OVERFLOW | overflow rate |
NODE_CE | node ce |
NODE_AREA | node surface area |
NODE_DQDH | node surcharge dqdh |
NODE_DENOM | node surcharge dqdh |
NODE_ITERATIONS | node iterations to this time step |
NODE_TIMESTEP | node iterations to this time step |
NODE_CONVERGENCE | node iterations to this time step |
NODE_QUAL | concentration of each pollutant |
Link Variables
Thursday, August 21, 2008
How Much Can You Learn From a Home DNA Test?
How much does your DNA determine your future? Our reporter has her DNA analyzed by three different labs, and shares every detail of the results... as well as how she copes with them.
read more | digg story
Friday, July 18, 2008
EMC Washoff in SWMM5
There are four steps to using EMC concentrations in your network:
1. Define your pollutant by adding a pollutant using the Data=>Quality=>Pollutant command:
2. Define the Land Use by using the Data=>Land Uses command or the Land Use Editor:
3. Define Buildup to be None by clicking on the None Tab:
4. Define the EMC Washoff concentration by clicking on the Washoff Tab:
This is where you would add a GW concentration
More: http://www.swmm2000.com/
Thursday, July 17, 2008
Friday, July 11, 2008
PuddleBlog
PuddleBlog is the image history of one small to large puddle on an American Street:
What is Puddleblog, you ask? Puddleblog chronicles the epic journey of one puddle, bracing for an uncertain future.
It’s a blog. You know, for a puddle. Specifically, the puddle that graces the corner of Jay and Plymouth, a couple blocks east of the Manhattan Bridge. Maybe if this thing catches on we can think about including other qualified puddles.
Tuesday, July 8, 2008
www.swmm5.info
Note www.swmm5.info now forwards to www.swmm2000.com which forwards to swmm2000.ning.com one of the wonderful Ning social network sites.
Saturday, July 5, 2008
SWMM 3,4 to 5 Converter Interface
The SWMM 3 and SWMM 4 converter can convert up to two files at one time to SWMM 5. Typically you would convert a Runoff and Transport file to SWMM 5 or a Runoff and Extran File to SWMM 5. If you have a combination of a SWMM 4 Runoff, Transport and Extran network then you will have to convert it in pieces and copy and past the two data sets together to make one SWMM 5 data set.
The x,y coordinate file is only necessary if you do not have existing x, y coordinates on the D1 line of the SWMM 4 Extran input data set.
You can use the command File=>Define Ini File to define the location of the ini file. The ini file will save your conversion project input data files and directories.
You can use the command File=>Define Your Text Editor to define the location of the text editor program. The ini file will save your conversion project editor name.
You can get a copy of the latest SWMM 3,4 to 5 Converter Here..
Friday, July 4, 2008
Hydrology in Ecclesiastes
1:5 The sun also ariseth, and the sun goeth down, and hasteth to his place where he arose.
1:6 The wind goeth toward the south, and turneth about unto the north;
it whirleth about continually, and the wind returneth again according
to his circuits.
1:7 All the rivers run into the sea; yet the sea is not full; unto the
place from whence the rivers come, thither they return again.
Note: This was a better description than in Aristotle.
Thursday, July 3, 2008
Hurricane Ivan in Pittsburgh, 2004
Pittsburgh
International Airport recorded the highest 24-hour rainfall for Pittsburgh, recording 5.95 in. of rain. NWS Pittsburgh Climate Data, August, 2004." Hourly Climate Data. Pittsburgh, PA. 21 June 2006. http://www.erh.noaa.gov/pbz/hourlyclimate.htm
Wednesday, July 2, 2008
Spatial Step in SWMM 5
SWMM 3,4,5 uses a spatial step equal to the length of the link. Or, in terms of the 1D St. Venant Equation for the calculation of flow used in SWMM 5:
In which is the length of the conduit.
The program will calculate the cross sectional area, hydraulic radius top width and depth at the upstream, midpoint and downstream sections of the link. The link solution is pivoted on the midpoint cross sectional area in the dominant dynamic wave terms and
and the non-linear term in the dynamic wave equation uses the upstream and downstream link cross sectional areas. In the finite difference equation in SWMM 5 the pipe shown below would have one length but use the cross sectional information from the upstream, midpoint and downstream points of the link.
The bend in the pipe would be modeled using the "other" category of losses
Tuesday, July 1, 2008
SWMM 5 Tools
In the newest version of EPA SWMM (5.0.1.11), there is a new feature of allowing for Add-ins and third-party tools. One such Add-in, the Microsoft Excel, can be very helpful for input data editing and model calibration.
1. To activate the Add-in
This process is detailed in pp. 141 of the EPA SWMM manual (http://www.epa.gov/ednnrmrl/models/swmm ... manual.pdf). Basically the user needs to go to "Tools->Program Preferences->Configure Tools" on SWMM main menu. Then in the pop-up "Tool Options" menu choose "Add." A "Tool Properties" window will pop-up, and the user can assign a name to the Excel Add-in for the "Name" field. For the "Program" field, the user needs to navigate to the location of the Excel executable file at "C:\Program Files\Microsoft Office\Office10\Excel.exe" (the file path may vary). Leave the "Working Directory" field as blank, and choose "INPFILE" macro for the "Parameters" field. Check both "Disable SWMM while executing" and "Update SWMM after closing."
After the above is set up, click OK and the Excel Add-in is registered in SWMM5. The Add-in tool is under the "Tools" menu. One important thing now is to go to "Tools->Program Preferences," and in the pop-up window check "Tab Delimited Project File."
2. Use the Excel Add-in
The SWMM5 input file by default is a tab-delimited .txt file. The user can view the file using Wordpad, but the editing is not very convenient, especially when it comes to calibration for a watershed with large number of subbasins. The Excel Add-in provides great relief for such operations.
Create a simple watershed model in SWMM, and then go to "Tools->Excel Editor (or whatever the user names the Add-in)." The input file for the watershed model is then displayed in tab-delimited format in Excel. In this environment, the user can edit the input data much easier (as compared to double-click each model component and key in the values in the Graphic User Interface). This becomes more apparent when the number of subbasins increases. When the editing is finished, close the Excel program, and then click "YES" or "OK" to all the pop-up windows. After that, the SWMM model interface pops back and the input parameters are updated.
So with this knowledge the model setup process can be much easier. In the initial model setup, the user may not bother to input any parameter values (i.e. subbasin area, width, slope, etc.). Instead, the model can be delineated and all components represented. Then the user can open the "Excel Editor" and copy/paste the model parameter values from another table of pre-created input parameter values (which is always the case). This process will totally by-pass the manually key-in of parameter values.
The second case of this feature applies is the model calibration. In a traditional way, suppose the user needs to change the value of depression storage for the impervious area. That means for a 30-subbasin watershed, the user needs to roam around the watershed and double-click 30 times to finish that single parameter change. Imagine if it takes five times to find the best value for that single parameter. With this feature, the user can open up the input file, set a depression storage value for the first subbasin, and then drag down for all the other 29 subbasins. Close Excel and go back to SWMM, and the updated model can be ran immediately.
Source: http://ceeforums.com/forum/viewtopic.php?f=26&t=256&p=582#p582
Wednesday, June 25, 2008
QA/QC Version of SWMM 5
This is my explanation of the comments on on the blog http://hhwq.blogspot.com about the CDM version of SWMM 5. It was purely a QA/QC testing program used in the code and data set migration of SWMM 4 to SWMM 5 during the years 2004 to 2007.
CDM version of SWMM5
CDM makes available their version version of SWMM5 for download and use. There's a few more options and the GUI element edit boxes have a lot more variable options. Otherwise, it looks, feels, and acts like the EPA version (from what I've have discerned).
http://groups.google.com/group/swmm5
4 comments:
EPA SWMM 5 Calibration Files
The EPA SWMM 5 calibration file is only for comparing the following 12 internal variables graphically to either SWMM 4 results, monitored data or some other model results:
- Subcatchment Runoff
- Subcatchment Washoff
- Node Water Depth
- Link Flow Rate
- Node Water Quality
- Node Lateral Inflow
- Node Flooding
- Groundwater Flow
- Groundwater Elevation
- Snow Pack Depth
- Link Flow Depth
- Link Flow Velocity
The graph on your SWMM 5 screen can be saved either to the clipboard or an external file for further manipulation of the computed and observed (calibration file data) by using the commands
Edit->Copy To=>Clipboard=>Text or
Edit->Copy To=>File=>Text
Just remember that the computed variable value comes first in the text followed by the observed variable value. For example:
Link 1030 Flow
Series Elapsed Time (hours) Flow CFS
Computed 0.1667 0.0000
.
.
Observed 0.0167 0.0000
Series Elapsed Time (hours) Flow CFS
Computed 0.1667 0.0000
.
.
Observed 0.0167 0.0000
Subscribe to:
Posts (Atom)
The Goal of SWMM5 Input Files
🌟 SWMM5 (Storm Water Management Model 5) is a widely used urban hydrology and hydraulic modeling software developed by the United States E...
-
@Innovyze User forum where you can ask questions about our Water and Wastewater Products http://t.co/dwgCOo3fSP pic.twitter.com/R0QKG2dv...
-
Subject: Detention Basin Basics in SWMM 5 What are the basic elements of a detention pond in SWMM 5? They are common in our back...
-
Engine Error Number Description ERROR 101: memory allocation error. ...
This version is a QA/QC version of SWMM 5 that was used to more closely compare the SWMM 4 to SWMM 5 results using extra data variables.
It should not be used for modeling. You should use the EPA SWMM Web site to download the latest EPA SWMM version:
http://www.epa.gov/ednnrmrl/models/swmm/index.htm